United States Table Butter Market Size & Outlook, 2025-2033
United States Table Butter Market Insights
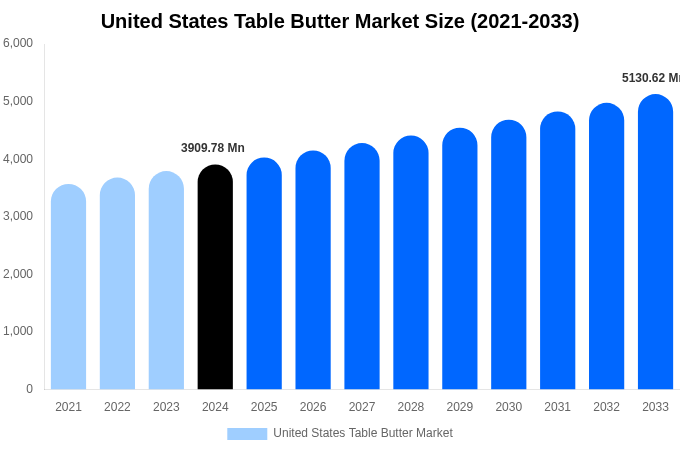
- According to Deep Market Insights analysis, the United States Table Butter Market size was USD 3909.78 Million in 2024 and is projected to reach USD 5130.62 Million by 2033.
- The United States market is projected to grow at a CAGR of 3.02% between 2026 and 2033.
- By segment, Salted Butter emerged as the largest Product Type in terms of market size in 2024.
- Salted Butter is anticipated to remain the most attractive Product Type segment, recording the fastest growth during the forecast period.
Source: DMI Analysis Company Publications, Primary Interviews.
Other Key Findings
- In 2024, United States represented 24.28% of the overall global Table Butter Market size.
- United States is projected to lead the global Table Butter Market size by 2033.
- Across North America, United States is anticipated to hold the dominant position in market size by 2033.
- United States is forecasted to expand at the fastest pace in North America, attaining USD 5110.3 Million by 2033.
Report Summary
| Report Scope | Details |
|---|---|
| Base Year for Study | 2024 |
| Study Period | 2021-2033 |
| Historical Period | 2021-2023 |
| Forecast Period | 2025-2033 |
| Market Size In 2024 | USD 3909.78 Million |
| Market Size In 2033 | USD 5130.62 Million |
| Largest segment | Salted Butter |
| Units | Revenue in USD Million |
| CAGR | 3.02% (2025-2033) |
| Segmnetation Covered | |
| Product Type |
|
| Fat Content |
|
| Usage |
|
| Report Coverage | Revenue Forecast, Competitive Landscape, Growth Factors, Environment & Regulatory Landscape and Trends |
United States Table Butter Market Product Type 2025-2033 (USD Million)
| Product Type | 2021 | 2022 | 2023 | 2024 | 2025 | 2026 | 2027 | 2028 | 2029 | 2030 | 2031 | 2032 | 2033 |
|---|---|---|---|---|---|---|---|---|---|---|---|---|---|
| Salted Butter | XX.x | XX.x | XX.x | 1592.84 | XX.x | XX.x | XX.x | XX.x | XX.x | XX.x | XX.x | XX.x | XX.x |
| Unsalted Butter | XX.x | XX.x | XX.x | XX.x | XX.x | XX.x | XX.x | XX.x | XX.x | XX.x | XX.x | XX.x | XX.x |
| Cultured Butter | XX.x | XX.x | XX.x | XX.x | XX.x | XX.x | XX.x | XX.x | XX.x | XX.x | XX.x | XX.x | XX.x |
| Blended Spreads | XX.x | XX.x | XX.x | XX.x | XX.x | XX.x | XX.x | XX.x | XX.x | XX.x | XX.x | XX.x | XX.x |
| Total | XX.x | XX.x | XX.x | XX.x | XX.x | XX.x | XX.x | XX.x | XX.x | XX.x | XX.x | XX.x | XX.x |
Source: DMI Analysis Company Publications, Primary Interviews.
United States Table Butter Market Fat Content 2025-2033 (USD Million)
| Fat Content | 2021 | 2022 | 2023 | 2024 | 2025 | 2026 | 2027 | 2028 | 2029 | 2030 | 2031 | 2032 | 2033 |
|---|---|---|---|---|---|---|---|---|---|---|---|---|---|
| Standard Fat | XX.x | XX.x | XX.x | 1681.99 | XX.x | XX.x | XX.x | XX.x | XX.x | XX.x | XX.x | XX.x | XX.x |
| Reduced Fat | XX.x | XX.x | XX.x | XX.x | XX.x | XX.x | XX.x | XX.x | XX.x | XX.x | XX.x | XX.x | XX.x |
| Grass-Fed | XX.x | XX.x | XX.x | XX.x | XX.x | XX.x | XX.x | XX.x | XX.x | XX.x | XX.x | XX.x | XX.x |
| Premium | XX.x | XX.x | XX.x | XX.x | XX.x | XX.x | XX.x | XX.x | XX.x | XX.x | XX.x | XX.x | XX.x |
| Total | XX.x | XX.x | XX.x | XX.x | XX.x | XX.x | XX.x | XX.x | XX.x | XX.x | XX.x | XX.x | XX.x |
Source: DMI Analysis Company Publications, Primary Interviews.
United States Table Butter Market Usage 2025-2033 (USD Million)
| Usage | 2021 | 2022 | 2023 | 2024 | 2025 | 2026 | 2027 | 2028 | 2029 | 2030 | 2031 | 2032 | 2033 |
|---|---|---|---|---|---|---|---|---|---|---|---|---|---|
| Household | XX.x | XX.x | XX.x | 1927.13 | XX.x | XX.x | XX.x | XX.x | XX.x | XX.x | XX.x | XX.x | XX.x |
| Baking | XX.x | XX.x | XX.x | XX.x | XX.x | XX.x | XX.x | XX.x | XX.x | XX.x | XX.x | XX.x | XX.x |
| Foodservice | XX.x | XX.x | XX.x | XX.x | XX.x | XX.x | XX.x | XX.x | XX.x | XX.x | XX.x | XX.x | XX.x |
| Industrial | XX.x | XX.x | XX.x | XX.x | XX.x | XX.x | XX.x | XX.x | XX.x | XX.x | XX.x | XX.x | XX.x |
| Total | XX.x | XX.x | XX.x | XX.x | XX.x | XX.x | XX.x | XX.x | XX.x | XX.x | XX.x | XX.x | XX.x |
Source: DMI Analysis Company Publications, Primary Interviews.