Middle East And Africa Interactive Tables Market Size & Outlook, 2025-2033
Middle East And Africa Interactive Tables Market Insights
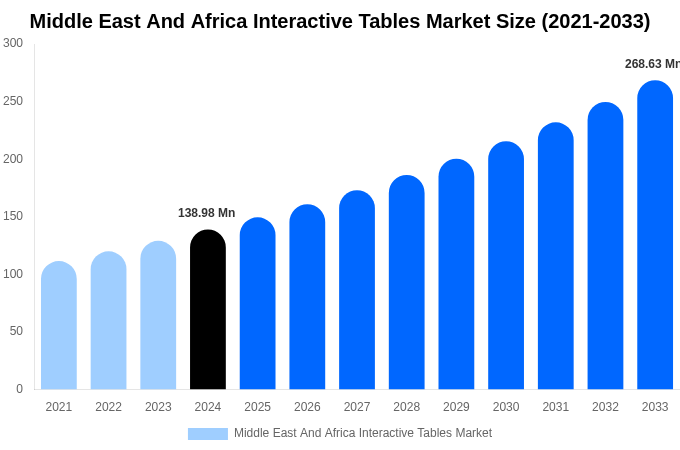
- According to Deep Market Insights analysis, the Middle East And Africa Interactive Tables Market size stood at USD 138.99 Million in 2024 and is forecasted to reach USD 270.34 Million by 2033.
- The market is projected to grow at a CAGR of 7.64% between 2026 and 2033.
- By segment, Below Forty Inch Tables was the leading Screen Size in terms of market size in 2024.
- Below Forty Inch Tables is expected to be the most lucrative Screen Size segment, exhibiting the fastest growth throughout the forecast period.
Source: DMI Analysis Company Publications, Primary Interviews.
Other Key Findings
- In 2024, Middle East And Africa contributed 10.65% to the overall global Interactive Tables Market size.
- By 2033, United States is anticipated to dominate the global market based on market size.
- South Africa is expected to witness the fastest growth within Middle East and Africa, attaining USD 25.28 Million by 2033.
Report Summary
| Report Scope | Details |
|---|---|
| Base Year for Study | 2024 |
| Study Period | 2021-2033 |
| Historical Period | 2021-2023 |
| Forecast Period | 2025-2033 |
| Market Size In 2024 | USD 138.99 Million |
| Market Size In 2033 | USD 270.34 Million |
| Largest segment | Below Forty Inch Tables |
| Units | Revenue in USD Million |
| CAGR | 7.64% (2025-2033) |
| Segmnetation Covered | |
| Middle East and Africa |
|
| Screen Size |
|
| Application |
|
| Technology |
|
| End User |
|
| Report Coverage | Revenue Forecast, Competitive Landscape, Growth Factors, Environment & Regulatory Landscape and Trends |
Middle East And Africa Interactive Tables Market Country 2025-2033 (USD Million)
| Middle East and Africa | 2021 | 2022 | 2023 | 2024 | 2025 | 2026 | 2027 | 2028 | 2029 | 2030 | 2031 | 2032 | 2033 |
|---|---|---|---|---|---|---|---|---|---|---|---|---|---|
| United Arab Emirates | XX.x | XX.x | XX.x | 67.72 | XX.x | XX.x | XX.x | XX.x | XX.x | XX.x | XX.x | XX.x | XX.x |
| Saudi Arabia | XX.x | XX.x | XX.x | XX.x | XX.x | XX.x | XX.x | XX.x | XX.x | XX.x | XX.x | XX.x | XX.x |
| South Africa | XX.x | XX.x | XX.x | XX.x | XX.x | XX.x | XX.x | XX.x | XX.x | XX.x | XX.x | XX.x | XX.x |
| Egypt | XX.x | XX.x | XX.x | XX.x | XX.x | XX.x | XX.x | XX.x | XX.x | XX.x | XX.x | XX.x | XX.x |
| Nigeria | XX.x | XX.x | XX.x | XX.x | XX.x | XX.x | XX.x | XX.x | XX.x | XX.x | XX.x | XX.x | XX.x |
| Turkey | XX.x | XX.x | XX.x | XX.x | XX.x | XX.x | XX.x | XX.x | XX.x | XX.x | XX.x | XX.x | XX.x |
| Total | XX.x | XX.x | XX.x | XX.x | XX.x | XX.x | XX.x | XX.x | XX.x | XX.x | XX.x | XX.x | XX.x |
Source: DMI Analysis Company Publications, Primary Interviews.
Middle East And Africa Interactive Tables Market Screen Size 2025-2033 (USD Million)
| Screen Size | 2021 | 2022 | 2023 | 2024 | 2025 | 2026 | 2027 | 2028 | 2029 | 2030 | 2031 | 2032 | 2033 |
|---|---|---|---|---|---|---|---|---|---|---|---|---|---|
| Below Forty Inch Tables | XX.x | XX.x | XX.x | 68.38 | XX.x | XX.x | XX.x | XX.x | XX.x | XX.x | XX.x | XX.x | XX.x |
| Forty To Sixty Inch Tables | XX.x | XX.x | XX.x | XX.x | XX.x | XX.x | XX.x | XX.x | XX.x | XX.x | XX.x | XX.x | XX.x |
| Above Sixty Inch Tables | XX.x | XX.x | XX.x | XX.x | XX.x | XX.x | XX.x | XX.x | XX.x | XX.x | XX.x | XX.x | XX.x |
| Total | XX.x | XX.x | XX.x | XX.x | XX.x | XX.x | XX.x | XX.x | XX.x | XX.x | XX.x | XX.x | XX.x |
Source: DMI Analysis Company Publications, Primary Interviews.
Middle East And Africa Interactive Tables Market Application 2025-2033 (USD Million)
| Application | 2021 | 2022 | 2023 | 2024 | 2025 | 2026 | 2027 | 2028 | 2029 | 2030 | 2031 | 2032 | 2033 |
|---|---|---|---|---|---|---|---|---|---|---|---|---|---|
| Education And Training | XX.x | XX.x | XX.x | 56.87 | XX.x | XX.x | XX.x | XX.x | XX.x | XX.x | XX.x | XX.x | XX.x |
| Retail And Showrooms | XX.x | XX.x | XX.x | XX.x | XX.x | XX.x | XX.x | XX.x | XX.x | XX.x | XX.x | XX.x | XX.x |
| Hospitality And Events | XX.x | XX.x | XX.x | XX.x | XX.x | XX.x | XX.x | XX.x | XX.x | XX.x | XX.x | XX.x | XX.x |
| Corporate Collaboration Spaces | XX.x | XX.x | XX.x | XX.x | XX.x | XX.x | XX.x | XX.x | XX.x | XX.x | XX.x | XX.x | XX.x |
| Total | XX.x | XX.x | XX.x | XX.x | XX.x | XX.x | XX.x | XX.x | XX.x | XX.x | XX.x | XX.x | XX.x |
Source: DMI Analysis Company Publications, Primary Interviews.
Middle East And Africa Interactive Tables Market Technology 2025-2033 (USD Million)
| Technology | 2021 | 2022 | 2023 | 2024 | 2025 | 2026 | 2027 | 2028 | 2029 | 2030 | 2031 | 2032 | 2033 |
|---|---|---|---|---|---|---|---|---|---|---|---|---|---|
| Capacitive Touch Tables | XX.x | XX.x | XX.x | 79.44 | XX.x | XX.x | XX.x | XX.x | XX.x | XX.x | XX.x | XX.x | XX.x |
| Infrared Touch Tables | XX.x | XX.x | XX.x | XX.x | XX.x | XX.x | XX.x | XX.x | XX.x | XX.x | XX.x | XX.x | XX.x |
| Total | XX.x | XX.x | XX.x | XX.x | XX.x | XX.x | XX.x | XX.x | XX.x | XX.x | XX.x | XX.x | XX.x |
Source: DMI Analysis Company Publications, Primary Interviews.
Middle East And Africa Interactive Tables Market End User 2025-2033 (USD Million)
| End User | 2021 | 2022 | 2023 | 2024 | 2025 | 2026 | 2027 | 2028 | 2029 | 2030 | 2031 | 2032 | 2033 |
|---|---|---|---|---|---|---|---|---|---|---|---|---|---|
| Schools And Universities | XX.x | XX.x | XX.x | 62.6 | XX.x | XX.x | XX.x | XX.x | XX.x | XX.x | XX.x | XX.x | XX.x |
| Enterprises And Offices | XX.x | XX.x | XX.x | XX.x | XX.x | XX.x | XX.x | XX.x | XX.x | XX.x | XX.x | XX.x | XX.x |
| Museums And Public Spaces | XX.x | XX.x | XX.x | XX.x | XX.x | XX.x | XX.x | XX.x | XX.x | XX.x | XX.x | XX.x | XX.x |
| Total | XX.x | XX.x | XX.x | XX.x | XX.x | XX.x | XX.x | XX.x | XX.x | XX.x | XX.x | XX.x | XX.x |
Source: DMI Analysis Company Publications, Primary Interviews.