Asia Pacific Interactive Tables Market Size & Outlook, 2025-2033
Asia Pacific Interactive Tables Market Insights
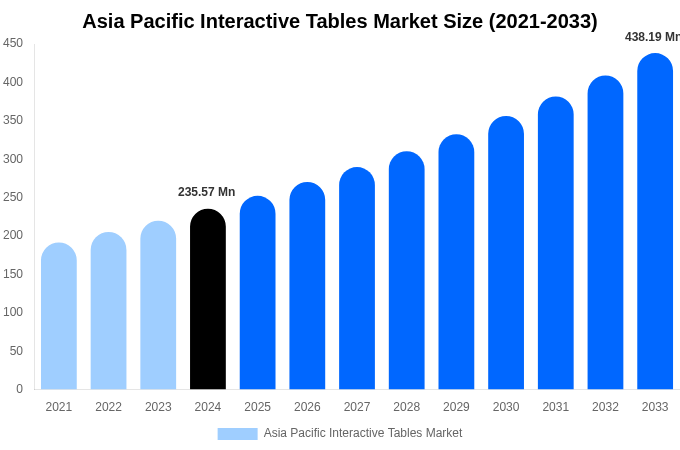
- Deep Market Insights analysis indicates that the Asia Pacific Interactive Tables Market size, which was USD 235.54 Million in 2024, is projected to attain USD 444.66 Million by 2033.
- The market is expected to register a CAGR of 7.23% over the period 2026–2033.
- In 2024, Below Forty Inch Tables emerged as the dominant Screen Size based on market size.
- Below Forty Inch Tables is projected to register the fastest growth, positioning it as the most attractive Screen Size segment over the forecast horizon.
Source: DMI Analysis Company Publications, Primary Interviews.
Other Key Findings
- Asia Pacific represented 18.05% of the global Interactive Tables Market size in 2024.
- By 2033, United States is estimated to hold the largest position in the global market in terms of size.
- Taiwan is estimated to remain the fastest-growing market in Asia Pacific, advancing to USD 29.12 Million by 2033.
Report Summary
| Report Scope | Details |
|---|---|
| Base Year for Study | 2024 |
| Study Period | 2021-2033 |
| Historical Period | 2021-2023 |
| Forecast Period | 2025-2033 |
| Market Size In 2024 | USD 235.54 Million |
| Market Size In 2033 | USD 444.66 Million |
| Largest segment | Below Forty Inch Tables |
| Units | Revenue in USD Million |
| CAGR | 7.23% (2025-2033) |
| Segmnetation Covered | |
| Asia Pacific |
|
| Screen Size |
|
| Application |
|
| Technology |
|
| End User |
|
| Report Coverage | Revenue Forecast, Competitive Landscape, Growth Factors, Environment & Regulatory Landscape and Trends |
Asia Pacific Interactive Tables Market Country 2025-2033 (USD Million)
| Asia Pacific | 2021 | 2022 | 2023 | 2024 | 2025 | 2026 | 2027 | 2028 | 2029 | 2030 | 2031 | 2032 | 2033 |
|---|---|---|---|---|---|---|---|---|---|---|---|---|---|
| China | XX.x | XX.x | XX.x | 90.62 | XX.x | XX.x | XX.x | XX.x | XX.x | XX.x | XX.x | XX.x | XX.x |
| India | XX.x | XX.x | XX.x | XX.x | XX.x | XX.x | XX.x | XX.x | XX.x | XX.x | XX.x | XX.x | XX.x |
| Japan | XX.x | XX.x | XX.x | XX.x | XX.x | XX.x | XX.x | XX.x | XX.x | XX.x | XX.x | XX.x | XX.x |
| Korea | XX.x | XX.x | XX.x | XX.x | XX.x | XX.x | XX.x | XX.x | XX.x | XX.x | XX.x | XX.x | XX.x |
| Taiwan | XX.x | XX.x | XX.x | XX.x | XX.x | XX.x | XX.x | XX.x | XX.x | XX.x | XX.x | XX.x | XX.x |
| Australia | XX.x | XX.x | XX.x | XX.x | XX.x | XX.x | XX.x | XX.x | XX.x | XX.x | XX.x | XX.x | XX.x |
| Singapore | XX.x | XX.x | XX.x | XX.x | XX.x | XX.x | XX.x | XX.x | XX.x | XX.x | XX.x | XX.x | XX.x |
| South East Asia | XX.x | XX.x | XX.x | XX.x | XX.x | XX.x | XX.x | XX.x | XX.x | XX.x | XX.x | XX.x | XX.x |
| Total | XX.x | XX.x | XX.x | XX.x | XX.x | XX.x | XX.x | XX.x | XX.x | XX.x | XX.x | XX.x | XX.x |
Source: DMI Analysis Company Publications, Primary Interviews.
Asia Pacific Interactive Tables Market Screen Size 2025-2033 (USD Million)
| Screen Size | 2021 | 2022 | 2023 | 2024 | 2025 | 2026 | 2027 | 2028 | 2029 | 2030 | 2031 | 2032 | 2033 |
|---|---|---|---|---|---|---|---|---|---|---|---|---|---|
| Below Forty Inch Tables | XX.x | XX.x | XX.x | 106.63 | XX.x | XX.x | XX.x | XX.x | XX.x | XX.x | XX.x | XX.x | XX.x |
| Forty To Sixty Inch Tables | XX.x | XX.x | XX.x | XX.x | XX.x | XX.x | XX.x | XX.x | XX.x | XX.x | XX.x | XX.x | XX.x |
| Above Sixty Inch Tables | XX.x | XX.x | XX.x | XX.x | XX.x | XX.x | XX.x | XX.x | XX.x | XX.x | XX.x | XX.x | XX.x |
| Total | XX.x | XX.x | XX.x | XX.x | XX.x | XX.x | XX.x | XX.x | XX.x | XX.x | XX.x | XX.x | XX.x |
Source: DMI Analysis Company Publications, Primary Interviews.
Asia Pacific Interactive Tables Market Application 2025-2033 (USD Million)
| Application | 2021 | 2022 | 2023 | 2024 | 2025 | 2026 | 2027 | 2028 | 2029 | 2030 | 2031 | 2032 | 2033 |
|---|---|---|---|---|---|---|---|---|---|---|---|---|---|
| Education And Training | XX.x | XX.x | XX.x | 108.64 | XX.x | XX.x | XX.x | XX.x | XX.x | XX.x | XX.x | XX.x | XX.x |
| Retail And Showrooms | XX.x | XX.x | XX.x | XX.x | XX.x | XX.x | XX.x | XX.x | XX.x | XX.x | XX.x | XX.x | XX.x |
| Hospitality And Events | XX.x | XX.x | XX.x | XX.x | XX.x | XX.x | XX.x | XX.x | XX.x | XX.x | XX.x | XX.x | XX.x |
| Corporate Collaboration Spaces | XX.x | XX.x | XX.x | XX.x | XX.x | XX.x | XX.x | XX.x | XX.x | XX.x | XX.x | XX.x | XX.x |
| Total | XX.x | XX.x | XX.x | XX.x | XX.x | XX.x | XX.x | XX.x | XX.x | XX.x | XX.x | XX.x | XX.x |
Source: DMI Analysis Company Publications, Primary Interviews.
Asia Pacific Interactive Tables Market Technology 2025-2033 (USD Million)
| Technology | 2021 | 2022 | 2023 | 2024 | 2025 | 2026 | 2027 | 2028 | 2029 | 2030 | 2031 | 2032 | 2033 |
|---|---|---|---|---|---|---|---|---|---|---|---|---|---|
| Capacitive Touch Tables | XX.x | XX.x | XX.x | 139.14 | XX.x | XX.x | XX.x | XX.x | XX.x | XX.x | XX.x | XX.x | XX.x |
| Infrared Touch Tables | XX.x | XX.x | XX.x | XX.x | XX.x | XX.x | XX.x | XX.x | XX.x | XX.x | XX.x | XX.x | XX.x |
| Total | XX.x | XX.x | XX.x | XX.x | XX.x | XX.x | XX.x | XX.x | XX.x | XX.x | XX.x | XX.x | XX.x |
Source: DMI Analysis Company Publications, Primary Interviews.
Asia Pacific Interactive Tables Market End User 2025-2033 (USD Million)
| End User | 2021 | 2022 | 2023 | 2024 | 2025 | 2026 | 2027 | 2028 | 2029 | 2030 | 2031 | 2032 | 2033 |
|---|---|---|---|---|---|---|---|---|---|---|---|---|---|
| Schools And Universities | XX.x | XX.x | XX.x | 109.2 | XX.x | XX.x | XX.x | XX.x | XX.x | XX.x | XX.x | XX.x | XX.x |
| Enterprises And Offices | XX.x | XX.x | XX.x | XX.x | XX.x | XX.x | XX.x | XX.x | XX.x | XX.x | XX.x | XX.x | XX.x |
| Museums And Public Spaces | XX.x | XX.x | XX.x | XX.x | XX.x | XX.x | XX.x | XX.x | XX.x | XX.x | XX.x | XX.x | XX.x |
| Total | XX.x | XX.x | XX.x | XX.x | XX.x | XX.x | XX.x | XX.x | XX.x | XX.x | XX.x | XX.x | XX.x |
Source: DMI Analysis Company Publications, Primary Interviews.