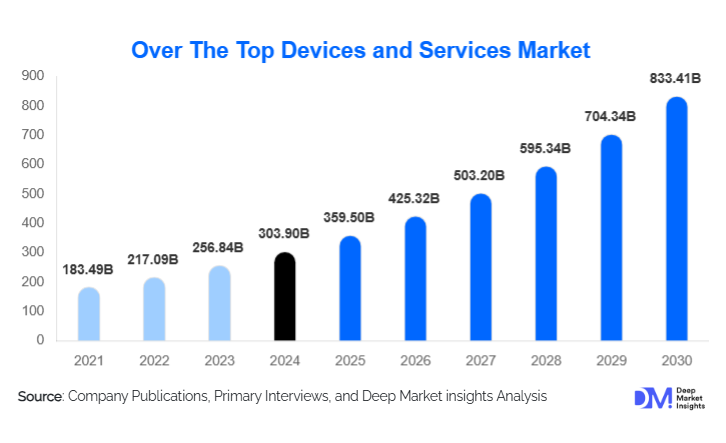
Over The Top Devices and Services Market Size
According to Deep Market Insights, the global over-the-top devices and services market size was valued at USD 303.9 billion in 2025 and is projected to grow from USD 359.5 billion in 2026 to reach USD 833.41 billion by 2031, expanding at a CAGR of 18.31% during the forecast period (2026–2031). The OTT devices and services market growth is primarily driven by rapid adoption of connected devices, widespread broadband and 5G deployment, cord-cutting from traditional pay TV, and the migration of video, audio, communications, and interactive applications to data-driven, cloud-based streaming platforms.
Key Market Insights
- Video OTT is the primary revenue engine, accounting for roughly 65–70% of the global OTT devices and services market value, led by premium SVOD, live sports, and ad-supported video platforms.
- Smart TVs and connected TV (CTV) devices have become the leading access points, representing around 38–40% of OTT viewing as the living room re-centers on app-centric TV operating systems.
- Subscription streaming still holds the largest revenue share (about 55–60%), but ad-supported and hybrid models are the fastest-growing as consumers face subscription fatigue and seek flexible pricing.
- North America dominates the OTT devices and services market, with the U.S. driving high ARPU, advanced CTV adoption, and intense competition among global streaming leaders.
- Asia-Pacific is the fastest-growing region, supported by mobile-first usage, rising middle-class incomes, and strong demand in China, India, and Southeast Asia.
- Media & entertainment is the largest end-use vertical, while enterprise OTT in collaboration, education, healthcare, BFSI, and retail is emerging as a high-margin growth frontier.
- Cloud-based deployments and AI-driven personalization now underpin most OTT platforms, enabling elastic scaling, advanced analytics, and targeted advertising.
Over The Top Devices and Services Market Trends
Ad-Supported and Hybrid Streaming Models Gaining Traction
OTT platforms are rapidly expanding ad-supported and hybrid tiers to counter subscription fatigue and broaden their addressable audience. Free ad-supported streaming TV (FAST) channels, curated linear streams, and AVOD libraries are becoming mainstream components of CTV home screens. Major SVOD providers are introducing lower-priced plans with targeted advertising, while maintaining premium ad-free options for high-value subscribers. This dual approach allows platforms to balance scale and ARPU, while advertisers benefit from granular targeting, brand-safe environments, and rich measurement capabilities. As a result, CTV and OTT video advertising are among the fastest-growing segments in the digital ad ecosystem.
Connected TV-Centric Ecosystems and Super-Aggregation
Emerging OTT trends are increasingly centered on connected TV ecosystems, where smart TVs, streaming sticks, and CTV set-top boxes host super-aggregated interfaces. Device and OS providers are investing heavily in app discovery, unified search, voice navigation, and personalized rows that combine content from multiple services. This “super-aggregator” approach simplifies consumer navigation across a fragmented OTT landscape while giving OS owners control over prime discovery real estate and advertising inventory. Partnerships between CTV platforms, telecom operators, and global streamers are intensifying as each party seeks to secure a dominant position in the living-room value chain.
Over The Top Devices and Services Market Drivers
Proliferation of Connected Devices and High-Speed Networks
The most fundamental driver of the OTT devices and services market is the explosive adoption of internet-connected hardware and high-speed connectivity. Increasing household penetration of smart TVs, streaming sticks, smartphones, tablets, laptops, and gaming consoles, combined with expanding 4G/5G and fiber infrastructure, enables reliable HD and 4K streaming across multiple screens. As homes become multi-device, multi-profile environments, OTT emerges as the default method for video, music, gaming, and real-time communications. The result is sustained growth in viewing hours, subscription counts, and ad impressions, directly translating into revenue expansion for OTT platforms and device ecosystems.
Cord-Cutting and Direct-to-Consumer Content Strategies
The structural shift from linear pay TV to streaming is another key growth driver. Consumers are abandoning or downsizing traditional channel bundles in favor of flexible, on-demand OTT services. Content owners, studios, broadcasters, and sports leagues are increasingly launching direct-to-consumer apps or deepening strategic partnerships with OTT platforms to access global audiences without relying solely on legacy distribution. This D2C emphasis allows providers to own customer data, experiment with release windows, and tailor pricing models. As more premium content migrates to or debuts on OTT platforms, the incentive for consumers to subscribe and remain engaged continues to strengthen.
Over The Top Devices and Services Market Restraints
Escalating Content and Customer Acquisition Costs
A major restraint for the OTT devices and services market is the rising cost of content and customer acquisition. The race to secure marquee franchises, local originals, and exclusive sports rights requires multibillion-dollar content budgets. Simultaneously, platforms face intense competition for user attention, leading to high spending on digital marketing, promotional offers, and retention incentives. For sub-scale or regional players, these costs can quickly erode margins and jeopardize long-term viability. Even for global leaders, profitability depends on carefully balancing content investments with disciplined growth strategies and efficient monetization of existing catalogs.
Regulatory Complexity and Market Fragmentation
The OTT landscape is increasingly affected by regulatory and structural challenges. Providers must comply with a patchwork of local rules on data privacy, content classification, censorship, taxation, and media ownership. Requirements such as data localization and local content quotas can add complexity and cost. At the same time, fragmentation across devices, operating systems, app stores, payment rails, and identity frameworks raises engineering and support burdens. Ensuring consistent quality, DRM, and monetization across a diverse device base is resource-intensive, particularly for smaller platforms, and can slow deployment of new features or expansions into new territories.
Over The Top Devices and Services Market Opportunities
Expansion of Ad-Supported Streaming and FAST Channels
The shift toward ad-supported and hybrid streaming models creates substantial opportunity for both incumbents and new entrants. Free ad-supported streaming TV (FAST) channels, thematic linear streams, and large AVOD libraries can capture price-sensitive segments while generating meaningful ad revenue. Platforms that develop strong ad-tech capabilities, including audience segmentation, dynamic ad insertion, and closed-loop attribution, are well-positioned to attract brand and performance marketers seeking measurable outcomes. Niche FAST channels focusing on genres, sports, kids’ content, or regional languages offer attractive economics, with low acquisition costs and high engagement in targeted audiences.
Localization, Telco Bundling, and Enterprise OTT Use Cases
High-growth regions such as Asia-Pacific, the Middle East, and Latin America present compelling opportunities for localized OTT strategies. Investment in local-language content, regional originals, and culturally relevant formats can rapidly build scale. Partnering with telecom operators and ISPs, through zero-rated data, integrated billing, and device preloads, removes friction from sign-ups and improves reach in price-sensitive markets. In parallel, extending OTT platforms into enterprise and vertical applications (collaboration, education, telehealth, virtual events, and shoppable video) unlocks new B2B revenue streams that rely more on platform capabilities than on expensive entertainment content, resulting in more resilient margins.
Product Type Insights
Within the OTT devices and services market, video streaming platforms make up the dominant product/service type, generating more than 70% of total revenue through subscription video-on-demand (SVOD), ad-supported video (AVOD), FAST, and transactional video services. These offerings rely on deep content catalogs, exclusive originals, and premium sports rights to attract and retain subscribers. OTT audio and music streaming represents a significant secondary segment, driven by recurring music subscriptions, podcasts, and audiobooks. Communication and collaboration OTT services, including messaging apps, VoIP, and enterprise video conferencing and team platforms, are rapidly scaling as businesses and institutions formalize hybrid work, remote learning, and virtual engagement models. Emerging OTT and cloud gaming services are still nascent but are expected to grow strongly as latency improves and high-performance streaming becomes more widely accessible.
Application Insights
Entertainment-focused applications remain the largest use case, encompassing movies, series, live TV, sports, music, and user-generated content. These applications dominate consumer time spent and monetization via subscriptions and ads. Communication and social OTT applications, such as messaging, calling, and social video platforms, support daily interactions and community building, and increasingly integrate short-form video and live streaming. Productivity and collaboration applications use OTT-style video delivery for meetings, webinars, and corporate communications, enabling distributed teams and remote work. In addition, education, telehealth, and live commerce applications are leveraging OTT infrastructure to deliver interactive classes, virtual consultations, and shoppable streaming, broadening the impact of OTT beyond pure entertainment into mission-critical services.
Distribution Channel Insights
Online app ecosystems and direct digital channels dominate distribution in the OTT devices and services market. Device app stores and CTV operating systems (e.g., Roku OS, Fire OS, Tizen, webOS, Android TV, iOS) are primary gateways for app discovery, downloads, and updates. Direct-to-consumer (D2C) websites and apps allow platforms to control billing, collect first-party data, and manage personalized offers and bundles. Telecom and ISP partnerships are particularly influential in emerging markets, where OTT services are embedded in broadband or mobile plans, often with discounted or zero-rated data. Additionally, aggregator platforms and super-aggregator interfaces on smart TVs and set-top boxes simplify subscription management by offering unified search, account linking, and integrated recommendations across multiple OTT services.
User Type Insights
The OTT devices and services market serves a diverse user base. Household and family users constitute the largest segment, typically maintaining multiple profiles and subscriptions for entertainment, kids’ content, and sports across shared devices. Young, digital-native users are heavy consumers of both premium OTT and user-generated or social video, often favoring mobile-first experiences, short-form formats, and flexible, low-cost plans. Enterprise and institutional users rely on OTT platforms for secure meetings, training, and large-scale virtual events, demanding robust reliability, integration with existing IT stacks, and compliance features. Education and learner users benefit from OTT-style portals for on-demand courses, live virtual classrooms, and exam preparation, highlighting the role of OTT in lifelong learning.
Age Group Insights
OTT adoption spans all age groups, but usage intensity and spending power vary. Viewers aged 25–44 years typically account for the largest share of subscription and transactional revenue, balancing family-oriented entertainment needs with strong purchasing power. The 18–24 cohort is highly engaged, particularly with mobile and social video platforms, but tends to be more price-sensitive and inclined toward ad-supported or shared subscription models. The 45–64 segment is increasingly comfortable with CTV and app-based viewing, favoring premium SVOD, news, and specialty content with relatively high loyalty. The 65+ demographic is gradually expanding its OTT usage as TV interfaces become more intuitive, creating opportunities for curated, easy-to-use services with enhanced accessibility, larger fonts, and simplified navigation.
| By Service Type | By Device Type | By Revenue Model |
|---|---|---|
|
|
|
Regional Insights
North America
North America is the largest regional market for OTT devices and services, accounting for around 40–41% of global revenue in 2025. The U.S. is the primary growth engine, benefiting from near-universal broadband access, high device penetration, and a dense concentration of global streaming leaders and CTV OS providers. Canada adds to regional strength with strong adoption of CTV, premium SVOD, and sports streaming. Market maturity means growth in North America is increasingly driven by price optimization, expansion of ad-supported tiers, and deeper CTV monetization rather than pure subscriber volume. Competition is intense, with platforms focusing heavily on original content, user experience, and bundled offerings.
Europe
Europe represents an estimated 20–25% of global OTT devices and services demand, led by the U.K., Germany, France, Italy, Spain, and the Nordics. European users access a mix of global OTT services and strong regional or national platforms that prioritize localized languages and content. Robust regulatory frameworks, including GDPR and content quotas, influence platform strategies and encourage investment in European originals. CTV adoption is high and continues to rise, with AVOD and FAST models gaining traction alongside subscription-based services. While economic growth is moderate, European markets deliver high-value audiences and sophisticated advertising ecosystems.
Asia-Pacific
Asia-Pacific is the fastest-growing region in the OTT devices and services market, accounting for roughly 25–30% of global revenue with strong upside potential. Markets such as China, India, Japan, South Korea, Australia, and major ASEAN economies drive expansion through mobile-first consumption, low-cost data plans, and rapidly rising middle-class incomes. Competition between global platforms and local champions is fierce, particularly in India and Southeast Asia, where regional-language content and innovative pricing (mobile-only plans, daily or weekly passes) are critical differentiators. APAC is also a leading arena for experimentation with social video, live commerce, and hybrid subscription-plus-ad models tailored to local preferences.
Latin America
Latin America contributes a mid-single to low-double digit share of global OTT devices and services revenue, with Brazil and Mexico as the leading markets and Argentina and the rest of LATAM showing steady growth. The region exhibits high engagement with video and social content but lower ARPUs compared to North America and Europe. Economic volatility, currency depreciation, and uneven broadband quality pose challenges, yet OTT adoption continues to expand as connectivity improves and CTV installations increase. Regional telenovelas, sports, and music thrive alongside global franchises, and platforms that localize effectively and leverage telco partnerships are best placed to win.
Middle East & Africa
The Middle East & Africa (MEA) region currently accounts for a smaller proportion of global OTT revenue but is growing rapidly from a low base. GCC countries, Turkey, South Africa, and North African markets are key demand centers. Government-backed digital agendas, expanding fiber and 5G networks, and youthful demographics all support rising OTT penetration. Local and regional platforms invest in Arabic and African-language content, religious programming, and regional dramas, while global services expand via partnerships with telecom operators and device manufacturers. As payment solutions improve and CTV penetration deepens, MEA is expected to deliver some of the highest percentage growth rates in OTT consumption.
| North America | Europe | APAC | Middle East and Africa | LATAM |
|---|---|---|---|---|
|
|
|
|
|
Key Players in the Over The Top Devices and Services Market
- Netflix Inc.
- Alphabet Inc. (YouTube)
- Amazon.com Inc. (Prime Video)
- The Walt Disney Company (Disney+ and Hulu)
- Tencent Holdings Ltd. (Tencent Video)
- Apple Inc. (Apple TV+)
- Warner Bros. Discovery, Inc. (Max)
- Comcast Corporation (Peacock)
- Paramount Global (Paramount+ and Pluto TV)
- Baidu Inc. (iQIYI)
- Alibaba Group (Youku)
- Roku Inc.
- DAZN Group Ltd.
- Spotify Technology S.A.
- Zee Entertainment Enterprises Ltd. (ZEE5)