Asia Pacific Performing Art Companies Market Size & Outlook, 2026-2034
Last Updated : 16 June, 2026 |
Study Period : 2022-2034 |
Format : PDF, Excel |
Author : Ethan Cole
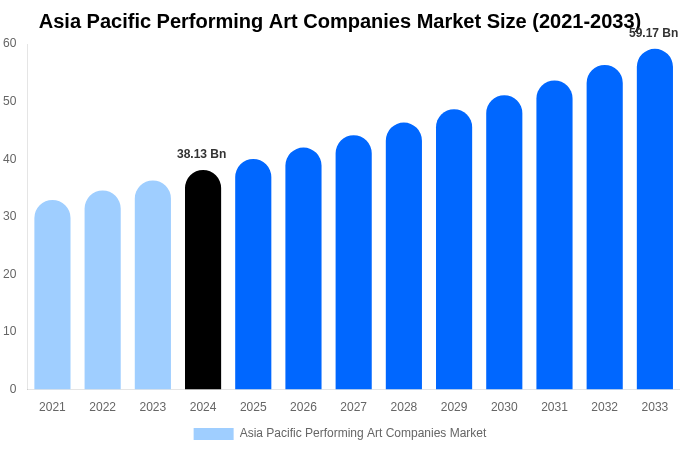
Asia Pacific Performing Art Companies Market Insights
- According to Deep Market Insights analysis, the Asia Pacific Performing Art Companies Market size stood at USD 30.51 Billion in 2025 and is forecasted to reach USD 47.81 Billion by 2034.
- The market is projected to grow at a CAGR of 5.11% between 2026 and 2034.
- By segment, Theater Companies was the leading Art Form in terms of market size in 2025.
- Theater Companies is expected to be the most lucrative Art Form segment, exhibiting the fastest growth throughout the forecast period.
Source: DMI Analysis Company Publications, Primary Interviews.
Other Key Findings
- In 2025, Asia Pacific contributed 15.82% to the overall global Performing Art Companies Market size.
- By 2034, United States is anticipated to dominate the global market based on market size.
- Taiwan is expected to witness the fastest growth within Asia Pacific, attaining USD 2.46 Billion by 2034.
Asia Pacific Performing Art Companies Market Country 2026-2034 (USD Billion)
| Asia Pacific | 2022 | 2023 | 2024 | 2025 | 2026 | 2027 | 2028 | 2029 | 2030 | 2031 | 2032 | 2033 | 2034 |
|---|---|---|---|---|---|---|---|---|---|---|---|---|---|
| China | XX.x | XX.x | XX.x | 12.7 | XX.x | XX.x | XX.x | XX.x | XX.x | XX.x | XX.x | XX.x | XX.x |
| India | XX.x | XX.x | XX.x | XX.x | XX.x | XX.x | XX.x | XX.x | XX.x | XX.x | XX.x | XX.x | XX.x |
| Japan | XX.x | XX.x | XX.x | XX.x | XX.x | XX.x | XX.x | XX.x | XX.x | XX.x | XX.x | XX.x | XX.x |
| Korea | XX.x | XX.x | XX.x | XX.x | XX.x | XX.x | XX.x | XX.x | XX.x | XX.x | XX.x | XX.x | XX.x |
| Taiwan | XX.x | XX.x | XX.x | XX.x | XX.x | XX.x | XX.x | XX.x | XX.x | XX.x | XX.x | XX.x | XX.x |
| Australia | XX.x | XX.x | XX.x | XX.x | XX.x | XX.x | XX.x | XX.x | XX.x | XX.x | XX.x | XX.x | XX.x |
| Singapore | XX.x | XX.x | XX.x | XX.x | XX.x | XX.x | XX.x | XX.x | XX.x | XX.x | XX.x | XX.x | XX.x |
| South East Asia | XX.x | XX.x | XX.x | XX.x | XX.x | XX.x | XX.x | XX.x | XX.x | XX.x | XX.x | XX.x | XX.x |
| Total | XX.x | XX.x | XX.x | 30.53 | XX.x | XX.x | XX.x | XX.x | XX.x | XX.x | XX.x | XX.x | XX.x |
Source: DMI Analysis Company Publications, Primary Interviews.
Asia Pacific Performing Art Companies Market Art Form 2026-2034 (USD Billion)
| Art Form | 2022 | 2023 | 2024 | 2025 | 2026 | 2027 | 2028 | 2029 | 2030 | 2031 | 2032 | 2033 | 2034 |
|---|---|---|---|---|---|---|---|---|---|---|---|---|---|
| Theater Companies | XX.x | XX.x | XX.x | 13.74 | XX.x | XX.x | XX.x | XX.x | XX.x | XX.x | XX.x | XX.x | XX.x |
| Dance Companies | XX.x | XX.x | XX.x | XX.x | XX.x | XX.x | XX.x | XX.x | XX.x | XX.x | XX.x | XX.x | XX.x |
| Music Performance Groups | XX.x | XX.x | XX.x | XX.x | XX.x | XX.x | XX.x | XX.x | XX.x | XX.x | XX.x | XX.x | XX.x |
| Total | XX.x | XX.x | XX.x | 30.51 | XX.x | XX.x | XX.x | XX.x | XX.x | XX.x | XX.x | XX.x | XX.x |
Source: DMI Analysis Company Publications, Primary Interviews.
Asia Pacific Performing Art Companies Market Performance Type 2026-2034 (USD Billion)
| Performance Type | 2022 | 2023 | 2024 | 2025 | 2026 | 2027 | 2028 | 2029 | 2030 | 2031 | 2032 | 2033 | 2034 |
|---|---|---|---|---|---|---|---|---|---|---|---|---|---|
| Live Performances | XX.x | XX.x | XX.x | 15.01 | XX.x | XX.x | XX.x | XX.x | XX.x | XX.x | XX.x | XX.x | XX.x |
| Touring Performances | XX.x | XX.x | XX.x | XX.x | XX.x | XX.x | XX.x | XX.x | XX.x | XX.x | XX.x | XX.x | XX.x |
| Virtual Performances | XX.x | XX.x | XX.x | XX.x | XX.x | XX.x | XX.x | XX.x | XX.x | XX.x | XX.x | XX.x | XX.x |
| Total | XX.x | XX.x | XX.x | 30.52 | XX.x | XX.x | XX.x | XX.x | XX.x | XX.x | XX.x | XX.x | XX.x |
Source: DMI Analysis Company Publications, Primary Interviews.
Asia Pacific Performing Art Companies Market Revenue Source 2026-2034 (USD Billion)
| Revenue Source | 2022 | 2023 | 2024 | 2025 | 2026 | 2027 | 2028 | 2029 | 2030 | 2031 | 2032 | 2033 | 2034 |
|---|---|---|---|---|---|---|---|---|---|---|---|---|---|
| Ticket Sales | XX.x | XX.x | XX.x | 15.88 | XX.x | XX.x | XX.x | XX.x | XX.x | XX.x | XX.x | XX.x | XX.x |
| Sponsorships | XX.x | XX.x | XX.x | XX.x | XX.x | XX.x | XX.x | XX.x | XX.x | XX.x | XX.x | XX.x | XX.x |
| Government Grants | XX.x | XX.x | XX.x | XX.x | XX.x | XX.x | XX.x | XX.x | XX.x | XX.x | XX.x | XX.x | XX.x |
| Total | XX.x | XX.x | XX.x | 30.51 | XX.x | XX.x | XX.x | XX.x | XX.x | XX.x | XX.x | XX.x | XX.x |
Source: DMI Analysis Company Publications, Primary Interviews.
Report Summary
| Report Scope | Details |
|---|---|
| Base Year for Study | 2025 |
| Study Period | 2022-2034 |
| Historical Period | 2022-2024 |
| Forecast Period | 2026-2034 |
| Market Size In 2025 | USD 30.51 Billion |
| Market Size In 2034 | USD 47.81 Billion |
| Largest segment | Theater Companies |
| Units | Revenue in USD Billion |
| CAGR | 5.11% (2026-2034) |
| Report Coverage | Revenue Forecast, Competitive Landscape, Growth Factors, Environment & Regulatory Landscape and Trends |