LATAM Brand Licensing Size & Outlook, 2026-2034
LATAM Brand Licensing Insights
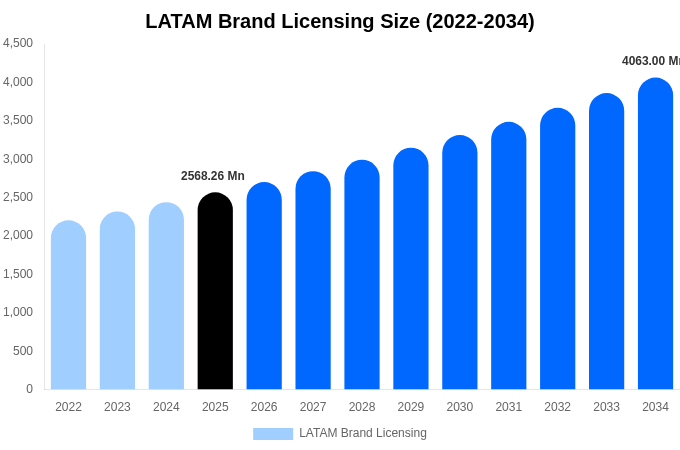
- As highlighted in Deep Market Insights analysis, the LATAM Brand Licensing, valued at USD 2568.27 Million in 2025, is estimated to achieve USD 4021.84 Million by 2034.
- The market is estimated to grow at a CAGR of 5.17% spanning 2026 to 2034.
- By market size, Toys & Games led the By Product Category category in 2025.
- The By Product Category segment led by Home Décor & Housewares is estimated to post the fastest growth, sustaining its position as the most lucrative during the forecast timeframe.
Source: DMI Analysis Company Publications, Primary Interviews.
Other Key Findings
- LATAM held 8.72% share of the global Brand Licensing size in 2025.
- United States is expected to remain the largest contributor to the global market size by 2034.
- By 2034, Brazil is anticipated to record the highest growth in LATAM, with the market size expected to reach USD 1561.15 Million.
Report Summary
| Report Scope | Details |
|---|---|
| Base Year for Study | 2025 |
| Study Period | 2022-2034 |
| Historical Period | 2022-2024 |
| Forecast Period | 2026-2034 |
| Market Size In 2025 | USD 2568.27 Million |
| Market Size In 2034 | USD 4021.84 Million |
| Largest segment | Toys & Games |
| Units | Revenue in USD Million |
| CAGR | 5.17% (2026-2034) |
| Segmnetation Covered | |
| LATAM |
|
| By Product Category |
|
| By Licensing Type |
|
| By Distribution Channel |
|
| By End Use Industry |
|
| Report Coverage | Revenue Forecast, Competitive Landscape, Growth Factors, Environment & Regulatory Landscape and Trends |
LATAM Brand Licensing Country 2026-2034 (USD Million)
| LATAM | 2022 | 2023 | 2024 | 2025 | 2026 | 2027 | 2028 | 2029 | 2030 | 2031 | 2032 | 2033 | 2034 |
|---|---|---|---|---|---|---|---|---|---|---|---|---|---|
| Brazil | XX.x | XX.x | XX.x | 980.82 | XX.x | XX.x | XX.x | XX.x | XX.x | XX.x | XX.x | XX.x | XX.x |
| Mexico | XX.x | XX.x | XX.x | XX.x | XX.x | XX.x | XX.x | XX.x | XX.x | XX.x | XX.x | XX.x | XX.x |
| Argentina | XX.x | XX.x | XX.x | XX.x | XX.x | XX.x | XX.x | XX.x | XX.x | XX.x | XX.x | XX.x | XX.x |
| Colombia | XX.x | XX.x | XX.x | XX.x | XX.x | XX.x | XX.x | XX.x | XX.x | XX.x | XX.x | XX.x | XX.x |
| Chile | XX.x | XX.x | XX.x | XX.x | XX.x | XX.x | XX.x | XX.x | XX.x | XX.x | XX.x | XX.x | XX.x |
| Total | XX.x | XX.x | XX.x | XX.x | XX.x | XX.x | XX.x | XX.x | XX.x | XX.x | XX.x | XX.x | XX.x |
Source: DMI Analysis Company Publications, Primary Interviews.
LATAM Brand Licensing By Product Category 2026-2034 (USD Million)
| By Product Category | 2022 | 2023 | 2024 | 2025 | 2026 | 2027 | 2028 | 2029 | 2030 | 2031 | 2032 | 2033 | 2034 |
|---|---|---|---|---|---|---|---|---|---|---|---|---|---|
| Apparel & Footwear | XX.x | XX.x | XX.x | 513.91 | XX.x | XX.x | XX.x | XX.x | XX.x | XX.x | XX.x | XX.x | XX.x |
| Toys & Games | XX.x | XX.x | XX.x | XX.x | XX.x | XX.x | XX.x | XX.x | XX.x | XX.x | XX.x | XX.x | XX.x |
| Home Décor & Housewares | XX.x | XX.x | XX.x | XX.x | XX.x | XX.x | XX.x | XX.x | XX.x | XX.x | XX.x | XX.x | XX.x |
| Food & Beverage | XX.x | XX.x | XX.x | XX.x | XX.x | XX.x | XX.x | XX.x | XX.x | XX.x | XX.x | XX.x | XX.x |
| Consumer Electronics | XX.x | XX.x | XX.x | XX.x | XX.x | XX.x | XX.x | XX.x | XX.x | XX.x | XX.x | XX.x | XX.x |
| Health & Beauty Products | XX.x | XX.x | XX.x | XX.x | XX.x | XX.x | XX.x | XX.x | XX.x | XX.x | XX.x | XX.x | XX.x |
| Publishing & Media Content | XX.x | XX.x | XX.x | XX.x | XX.x | XX.x | XX.x | XX.x | XX.x | XX.x | XX.x | XX.x | XX.x |
| Stationery & Gifts | XX.x | XX.x | XX.x | XX.x | XX.x | XX.x | XX.x | XX.x | XX.x | XX.x | XX.x | XX.x | XX.x |
| Sports Merchandise | XX.x | XX.x | XX.x | XX.x | XX.x | XX.x | XX.x | XX.x | XX.x | XX.x | XX.x | XX.x | XX.x |
| Luxury Goods & Accessories | XX.x | XX.x | XX.x | XX.x | XX.x | XX.x | XX.x | XX.x | XX.x | XX.x | XX.x | XX.x | XX.x |
| Total | XX.x | XX.x | XX.x | XX.x | XX.x | XX.x | XX.x | XX.x | XX.x | XX.x | XX.x | XX.x | XX.x |
Source: DMI Analysis Company Publications, Primary Interviews.
LATAM Brand Licensing By Licensing Type 2026-2034 (USD Million)
| By Licensing Type | 2022 | 2023 | 2024 | 2025 | 2026 | 2027 | 2028 | 2029 | 2030 | 2031 | 2032 | 2033 | 2034 |
|---|---|---|---|---|---|---|---|---|---|---|---|---|---|
| Corporate Brand Licensing | XX.x | XX.x | XX.x | 642.07 | XX.x | XX.x | XX.x | XX.x | XX.x | XX.x | XX.x | XX.x | XX.x |
| Entertainment & Character Licensing | XX.x | XX.x | XX.x | XX.x | XX.x | XX.x | XX.x | XX.x | XX.x | XX.x | XX.x | XX.x | XX.x |
| Sports Licensing | XX.x | XX.x | XX.x | XX.x | XX.x | XX.x | XX.x | XX.x | XX.x | XX.x | XX.x | XX.x | XX.x |
| Fashion Licensing | XX.x | XX.x | XX.x | XX.x | XX.x | XX.x | XX.x | XX.x | XX.x | XX.x | XX.x | XX.x | XX.x |
| Art & Design Licensing | XX.x | XX.x | XX.x | XX.x | XX.x | XX.x | XX.x | XX.x | XX.x | XX.x | XX.x | XX.x | XX.x |
| Collegiate & Non-Profit Licensing | XX.x | XX.x | XX.x | XX.x | XX.x | XX.x | XX.x | XX.x | XX.x | XX.x | XX.x | XX.x | XX.x |
| Celebrity & Influencer Licensing | XX.x | XX.x | XX.x | XX.x | XX.x | XX.x | XX.x | XX.x | XX.x | XX.x | XX.x | XX.x | XX.x |
| Music Licensing | XX.x | XX.x | XX.x | XX.x | XX.x | XX.x | XX.x | XX.x | XX.x | XX.x | XX.x | XX.x | XX.x |
| Total | XX.x | XX.x | XX.x | XX.x | XX.x | XX.x | XX.x | XX.x | XX.x | XX.x | XX.x | XX.x | XX.x |
Source: DMI Analysis Company Publications, Primary Interviews.
LATAM Brand Licensing By Distribution Channel 2026-2034 (USD Million)
| By Distribution Channel | 2022 | 2023 | 2024 | 2025 | 2026 | 2027 | 2028 | 2029 | 2030 | 2031 | 2032 | 2033 | 2034 |
|---|---|---|---|---|---|---|---|---|---|---|---|---|---|
| Online Retail | XX.x | XX.x | XX.x | 786.66 | XX.x | XX.x | XX.x | XX.x | XX.x | XX.x | XX.x | XX.x | XX.x |
| Department & Specialty Stores | XX.x | XX.x | XX.x | XX.x | XX.x | XX.x | XX.x | XX.x | XX.x | XX.x | XX.x | XX.x | XX.x |
| Mass Retailers & Hypermarkets | XX.x | XX.x | XX.x | XX.x | XX.x | XX.x | XX.x | XX.x | XX.x | XX.x | XX.x | XX.x | XX.x |
| Direct-to-Consumer (D2C) Brand Stores | XX.x | XX.x | XX.x | XX.x | XX.x | XX.x | XX.x | XX.x | XX.x | XX.x | XX.x | XX.x | XX.x |
| Franchise Outlets | XX.x | XX.x | XX.x | XX.x | XX.x | XX.x | XX.x | XX.x | XX.x | XX.x | XX.x | XX.x | XX.x |
| Entertainment & Theme Parks | XX.x | XX.x | XX.x | XX.x | XX.x | XX.x | XX.x | XX.x | XX.x | XX.x | XX.x | XX.x | XX.x |
| Total | XX.x | XX.x | XX.x | XX.x | XX.x | XX.x | XX.x | XX.x | XX.x | XX.x | XX.x | XX.x | XX.x |
Source: DMI Analysis Company Publications, Primary Interviews.
LATAM Brand Licensing By End Use Industry 2026-2034 (USD Million)
| By End Use Industry | 2022 | 2023 | 2024 | 2025 | 2026 | 2027 | 2028 | 2029 | 2030 | 2031 | 2032 | 2033 | 2034 |
|---|---|---|---|---|---|---|---|---|---|---|---|---|---|
| Entertainment & Media | XX.x | XX.x | XX.x | 711.92 | XX.x | XX.x | XX.x | XX.x | XX.x | XX.x | XX.x | XX.x | XX.x |
| Fashion & Lifestyle | XX.x | XX.x | XX.x | XX.x | XX.x | XX.x | XX.x | XX.x | XX.x | XX.x | XX.x | XX.x | XX.x |
| Sports & Recreation | XX.x | XX.x | XX.x | XX.x | XX.x | XX.x | XX.x | XX.x | XX.x | XX.x | XX.x | XX.x | XX.x |
| Retail & E-commerce | XX.x | XX.x | XX.x | XX.x | XX.x | XX.x | XX.x | XX.x | XX.x | XX.x | XX.x | XX.x | XX.x |
| Food & Beverage | XX.x | XX.x | XX.x | XX.x | XX.x | XX.x | XX.x | XX.x | XX.x | XX.x | XX.x | XX.x | XX.x |
| Publishing & Education | XX.x | XX.x | XX.x | XX.x | XX.x | XX.x | XX.x | XX.x | XX.x | XX.x | XX.x | XX.x | XX.x |
| Technology & Gaming | XX.x | XX.x | XX.x | XX.x | XX.x | XX.x | XX.x | XX.x | XX.x | XX.x | XX.x | XX.x | XX.x |
| Hospitality & Events | XX.x | XX.x | XX.x | XX.x | XX.x | XX.x | XX.x | XX.x | XX.x | XX.x | XX.x | XX.x | XX.x |
| Total | XX.x | XX.x | XX.x | XX.x | XX.x | XX.x | XX.x | XX.x | XX.x | XX.x | XX.x | XX.x | XX.x |
Source: DMI Analysis Company Publications, Primary Interviews.