Non-Photo Personalized Gifts Market Size
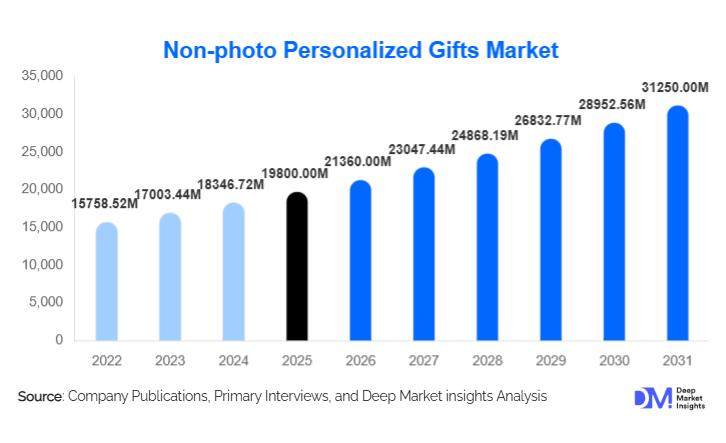
According to Deep Market Insights, the global non-photo personalized gifts market size was valued at USD 19,800 million in 2025 and is projected to grow from USD 21,360 million in 2026 to reach USD 31,250 million by 2031, expanding at a CAGR of 7.9% during the forecast period (2026–2031). The non-photo personalized gifts market growth is primarily driven by rising consumer preference for meaningful and utility-driven gifting, increasing adoption of customized corporate gifting solutions, and rapid expansion of e-commerce-enabled mass personalization capabilities.
Key Market Insights
- Engraved hard goods dominate the global market, supported by strong corporate and institutional gifting demand.
- Corporate and enterprise gifting is the fastest-growing end-use segment, driven by employee engagement and brand-building initiatives.
- Online direct-to-consumer channels account for the majority of sales, benefiting from real-time customization and preview technologies.
- Asia-Pacific is the fastest-growing regional market, led by India and China, due to a festival-driven gifting culture.
- North America remains the largest market, supported by premium gifting trends and high corporate spending.
- Advancements in laser engraving and digital printing technologies are enabling scalable mass customization and margin expansion.
What are the latest trends in the non-photo personalized gifts market?
Premiumization of Everyday Gifting
Consumers are increasingly opting for premium non-photo personalized gifts that combine emotional value with daily utility. Products such as engraved metal accessories, customized drinkware, and monogrammed home décor are replacing generic gifts across personal and professional occasions. This trend is particularly strong in corporate gifting, where personalization enhances brand recall and perceived value. Premium materials, minimalist design aesthetics, and durable finishes are becoming key purchase criteria, driving higher average selling prices across developed markets.
Technology-Enabled Mass Customization
Rapid adoption of laser engraving, CNC machining, and AI-powered design preview tools is reshaping the market. E-commerce platforms now allow consumers and corporate buyers to visualize text placement, fonts, and finishes in real time, reducing order errors and return rates. Automated production lines are enabling manufacturers to handle high-volume customized orders efficiently, making personalization economically viable even at scale. This trend is accelerating the shift toward direct-to-consumer business models.
What are the key drivers in the non-photo personalized gifts market?
Rising Demand for Meaningful and Functional Gifting
Global gifting behavior is shifting toward products that offer emotional connection while retaining functional value. Non-photo personalized gifts such as engraved accessories, customized stationery, and monogrammed home items offer longevity and relevance across age groups. This driver is especially prominent in milestone occasions such as weddings, anniversaries, and professional achievements, where permanence and personalization are highly valued.
Growth of Corporate Branding and Employee Engagement Spend
Organizations are increasingly allocating budgets to personalized non-photo gifts as part of employee onboarding, client retention, and internal recognition programs. Engraved desk accessories, branded drinkware, and customized kits are widely used to reinforce corporate identity. This driver provides year-round demand stability and higher order volumes, supporting consistent market growth.
What are the restraints for the global market?
Price Sensitivity in Emerging Economies
While personalization adds perceived value, cost sensitivity remains a challenge in price-conscious markets. Consumers in developing regions may limit adoption unless manufacturers offer affordable materials and simplified customization options. This restricts penetration of premium personalized products in mass-market segments.
Operational Complexity and Fulfillment Challenges
Customization increases SKU complexity and requires precise quality control. Managing short lead times, inventory variability, and bulk corporate orders can strain smaller manufacturers. Inadequate automation and logistics capabilities may slow scalability for new entrants.
What are the key opportunities in the non-photo personalized gifts industry?
Expansion of Corporate and Institutional Gifting Programs
Corporate, educational, and government institutions present a significant opportunity for large-volume, repeat orders. As organizations focus more on culture-building and brand differentiation, demand for engraved and text-personalized gifts is expected to rise steadily. Suppliers offering design consistency, fast turnaround, and compliance with procurement standards can gain long-term contracts.
Growth in Emerging Markets and Festival-Based Gifting
Emerging economies in Asia-Pacific, the Middle East, and Latin America are witnessing strong growth driven by cultural gifting traditions and rising disposable incomes. Localized language engraving and culturally relevant designs present opportunities for regional customization strategies. Festival-driven demand cycles provide predictable seasonal revenue spikes.
Report Scope
| Report Metric | Details |
|---|---|
| Market Size in 2025 | USD 19800 Million |
| Market Size in 2026 | USD 21360 Million |
| Market Size in 2031 | USD 31250 Million |
| CAGR | 7.9% (2026-2031) |
| Base Year for Estimation | 2025 |
| Historical Data | 2022-2024 |
| Forecast Period | 2026-2031 |
| Report Coverage | Revenue Forecast, Competitive Landscape, Supply Chain Disruption, Growth Factors, Environment & Regulatory Landscape and Trends |
| Geographies Covered | North America, Europe, APAC, Middle East and Africa, LATAM |
| Countries Covered | U.S., Canada, U.K., Germany, France, Spain, Italy, Russia, Nordic, Benelux, Rest of Europe, China, Korea, Japan, India, Australia, Singapore, Taiwan, South East Asia, Rest of Asia-Pacific, UAE, Turky, Saudi Arabia, South Africa, Egypt, Nigeria, Rest of MEA, Brazil, Mexico, Argentina, Chile, Colombia, Rest of LATAM |
Explore more data points, trends and opportunities Download Free Sample Report
Product Type Insights
Engraved hard goods account for approximately 34% of the 2025 market share, leading due to durability, premium appeal, and widespread use in corporate gifting. Text-personalized soft goods represent around 22%, driven by apparel and home textiles with high repeat purchase rates. Personalized home and lifestyle décor contribute nearly 18%, supported by home improvement trends and lifestyle spending. Name- and initial-based accessories hold about 16%, benefiting from impulse buying and fashion-driven demand. Personalized consumables, including customized chocolates and beverages, account for roughly 10% and are growing rapidly in premium gifting segments.
End-Use Insights
Individual consumers remain the largest end-use segment by volume, driven by birthdays, weddings, and personal milestones. However, corporates and enterprises represent the fastest-growing segment, expanding at over 9% CAGR, supported by employee engagement, branding, and client gifting programs. Institutional end users, including educational and government organizations, provide a stable demand through recognition and ceremonial gifting. Emerging applications in hospitality, welcome kits, and real estate closing gifts are creating incremental growth opportunities.
Distribution Channel Insights
Online direct-to-consumer platforms dominate the market, accounting for an estimated 58% of global sales, driven by ease of customization, broader product selection, and competitive pricing. Online marketplaces remain important discovery channels, while specialty gift stores retain relevance for premium and last-minute purchases. Corporate sourcing firms play a critical role in bulk procurement and long-term contracts for enterprise clients.
Explore more data points, trends and opportunities Download Free Sample Report
Non-photo Personalized Gifts Market Segmentations
By Product Type
- Engraved Hard Goods (Metal, Glass, Wood)
- Text-Personalized Soft Goods (Apparel, Home Textiles)
- Name & Initial-Based Accessories (Bags, Wallets, Phone Cases)
- Personalized Home & Lifestyle Décor
- Personalized Consumables (Chocolates, Beverages, Food Hampers)
By Personalization Technique
- Laser Engraving
- Embossing & Debossing
- Digital Text Printing
- Handcrafted Personalization
- CNC & Etching Technologies
By Occasion
- Corporate Gifting
- Festivals & Holidays
- Weddings & Anniversaries
- Birthdays & Milestones
- Promotional & Branding Use
By Distribution Channel
- Online Direct-to-Consumer
- Online Marketplaces
- Specialty Gift Stores
- Corporate & B2B Sourcing Firms
By End-User
- Individual Consumers
- Corporates & Enterprises
- Institutions & Organizations
Regional Insights
North America
North America holds approximately 32% of the global market share, led by the United States. High corporate gifting budgets, strong premiumization trends, and advanced personalization technologies support market dominance. Canada also contributes a steady demand, particularly in corporate and institutional segments.
Europe
Europe accounts for nearly 26% of the market, with the U.K., Germany, and France leading demand. Sustainability-conscious consumers and strong demand for premium engraved products characterize the region. Corporate gifting remains a key revenue driver.
Asia-Pacific
Asia-Pacific represents about 28% of the market and is the fastest-growing region, with a CAGR exceeding 9%. China and India lead growth due to festival-driven gifting, expanding middle-class populations, and rapid e-commerce adoption. Japan and South Korea contribute a steady premium demand.
Latin America
Latin America accounts for roughly 6% of the global market. Brazil and Mexico are key contributors, supported by growing interest in personalized accessories and home décor. Market growth is driven by urbanization and rising gifting culture among younger consumers.
Middle East & Africa
The Middle East & Africa region holds around 8% of the market. The UAE and Saudi Arabia drive premium and corporate gifting demand, while South Africa leads within Africa due to established retail and corporate gifting ecosystems.
Key Players in the Non-Photo Personalized Gifts Market
- Things Remembered
- Hallmark (Personalized Division)
- Cimpress
- Personalization Mall
- Shutterfly (Non-photo segment)
- Moonpig Group
- American Greetings
- VistaPrint
- Funky Pigeon
- Zazzle
- Archies Limited
- CafePress
- Printful
- ProFlowers (Non-photo category)
- Etsy Inc. (Private label brands)