No-Show Socks Market Size
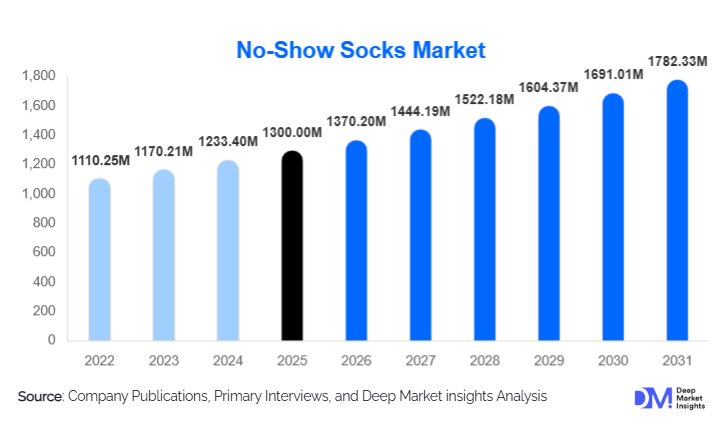
According to Deep Market Insights, the global no-show socks market size was valued at USD 1,300.00 million in 2025 and is projected to grow from USD 1,370.20 million in 2026 to reach USD 1,782.33 million by 2031, expanding at a CAGR of 5.4% during the forecast period (2026–2031). Market growth is primarily driven by rising adoption of casual and athleisure footwear, increasing consumer preference for minimalist and invisible apparel accessories, and continuous innovation in fabric blends, grip technology, and moisture-management features.
Key Market Insights
- No-show socks have transitioned from niche accessories to daily essentials, supported by the global shift toward sneakers, loafers, and slip-on footwear.
- Silicone-grip and seamless no-show socks dominate premium demand, addressing long-standing issues related to slipping and discomfort.
- Asia-Pacific leads global consumption, driven by high population density, footwear manufacturing concentration, and price-sensitive mass demand.
- North America remains the largest value market, supported by premium pricing, brand loyalty, and high replacement rates.
- Online and direct-to-consumer channels are reshaping distribution, enabling faster product innovation cycles and margin expansion.
- Sustainable materials such as bamboo fiber and organic cotton are increasingly influencing consumer purchasing decisions.
What are the latest trends in the no-show socks market?
Premiumization Through Functional Design
The market is witnessing a clear shift toward performance-enhanced no-show socks featuring silicone heel grips, seamless construction, arch support, and anti-odor treatments. Consumers are increasingly prioritizing comfort, durability, and fit reliability, even at higher price points. This trend is especially visible in urban markets where consumers prefer fewer but higher-quality apparel essentials. Brands are investing in proprietary knitting technologies and material blends to differentiate offerings and command premium margins.
Sustainability and Eco-Friendly Materials
Sustainability has emerged as a defining trend, with growing demand for no-show socks manufactured using bamboo fiber, recycled polyester, and organic cotton. Environmentally conscious consumers are influencing product labeling, packaging, and sourcing strategies. Brands are responding by adopting low-impact dyes, recyclable packaging, and transparent supply chain practices, particularly in North America and Europe.
What are the key drivers in the no-show socks market?
Expansion of Casual and Athleisure Footwear
The global shift toward casual dressing has significantly increased demand for invisible socks. Sneakers, boat shoes, loafers, and slip-ons now dominate daily wear, directly driving consistent consumption of no-show socks across both professional and lifestyle settings.
Rising Focus on Comfort and Foot Hygiene
Growing awareness around foot health, sweat management, and odor control is accelerating replacement cycles. Advanced moisture-wicking fabrics and antimicrobial treatments have positioned no-show socks as functional necessities rather than optional accessories.
What are the restraints for the global market?
High Price Sensitivity in Emerging Markets
In developing regions, consumers often opt for low-cost unbranded alternatives, limiting penetration of premium products. Intense competition from unorganized manufacturers puts pressure on pricing and margins.
Product Performance Limitations
Issues such as slippage, loss of elasticity, and reduced durability after repeated washing continue to impact customer satisfaction, particularly in lower-quality segments.
What are the key opportunities in the no-show socks industry?
Growth in Emerging Urban Markets
Rapid urbanization in Asia-Pacific, Latin America, and the Middle East is creating sustained demand for affordable, mass-market no-show socks. Localized manufacturing and value pricing present strong entry opportunities.
Direct-to-Consumer and Subscription Models
DTC platforms allow brands to improve margins, launch limited-edition collections, and offer subscription-based replenishment models for innerwear essentials, increasing customer lifetime value.
Report Scope
| Report Metric | Details |
|---|---|
| Market Size in 2025 | USD 1300 Million |
| Market Size in 2026 | USD 1370.2 Million |
| Market Size in 2031 | USD 1782.33 Million |
| CAGR | 5.4% (2026-2031) |
| Base Year for Estimation | 2025 |
| Historical Data | 2022-2024 |
| Forecast Period | 2026-2031 |
| Report Coverage | Revenue Forecast, Competitive Landscape, Supply Chain Disruption, Growth Factors, Environment & Regulatory Landscape and Trends |
| Geographies Covered | North America, Europe, APAC, Middle East and Africa, LATAM |
| Countries Covered | U.S., Canada, U.K., Germany, France, Spain, Italy, Russia, Nordic, Benelux, Rest of Europe, China, Korea, Japan, India, Australia, Singapore, Taiwan, South East Asia, Rest of Asia-Pacific, UAE, Turky, Saudi Arabia, South Africa, Egypt, Nigeria, Rest of MEA, Brazil, Mexico, Argentina, Chile, Colombia, Rest of LATAM |
Explore more data points, trends and opportunities Download Free Sample Report
Product Type Insights
Silicone-grip no-show socks accounted for approximately 34% of global market revenue in 2024, leading the segment due to superior fit retention, reduced slippage, and improved comfort during extended wear. These products are widely adopted in athletic, casual, and premium lifestyle footwear. Classic and liner no-show socks continue to generate high sales volumes, particularly in price-sensitive and mass-market regions, driven by affordability and wide availability. Seamless and compression variants are gaining traction in premium and athletic applications, supported by demand for enhanced support, reduced friction, and performance-oriented design.
Material Type Insights
Cotton-based no-show socks dominate the market with nearly 41% share, supported by breathability, skin comfort, cost-effectiveness, and widespread consumer familiarity. Synthetic blends, including polyester and nylon-based materials, follow closely, offering enhanced durability, elasticity, and moisture-wicking performance. Bamboo fiber and wool-based variants represent smaller but fast-growing segments, driven by sustainability positioning, odor resistance, and temperature-regulation benefits, particularly in premium and eco-conscious consumer segments.
End-Use Insights
Casual and everyday wear represents the largest end-use segment, accounting for around 52% of total demand, supported by daily footwear usage and broad consumer adoption. Sports and athletic use is the fastest-growing segment, expanding at over 7% CAGR, driven by rising gym memberships, increasing fitness participation, and continued athleisure adoption. Formal and office wear demand remains stable, particularly in urban professional markets, where discreet designs compatible with dress shoes are preferred.
Distribution Channel Insights
Online channels accounted for approximately 38% of global sales in 2024, driven by the expansion of direct-to-consumer brands, subscription-based purchasing models, and influencer-led digital marketing strategies. Offline retail remains dominant in volume terms, particularly across hypermarkets, supermarkets, and department stores in Asia-Pacific and Latin America, where in-store purchasing and bundled promotions continue to influence buying behavior.
Explore more data points, trends and opportunities Download Free Sample Report
No-Show Socks Market Segmentations
By Product Type
- Classic No-Show Socks
- Liner / Ultra-Low Cut Socks
- Silicone-Grip No-Show Socks
- Athletic No-Show Socks
- Seamless / Compression No-Show Socks
By Material Type
- Cotton-Based
- Polyester & Synthetic Blends
- Bamboo Fiber
- Wool-Based
- Nylon & Elastane Blends
By Gender
- Men
- Women
- Unisex
By End Use
- Casual & Everyday Wear
- Sports & Athletic Use
- Formal & Office Wear
- Fashion & Lifestyle Use
By Distribution Channel
- Offline Retail Stores
- Online Direct-to-Consumer
- Online Marketplaces
Regional Insights
Asia-Pacific
Asia-Pacific held approximately 36% of global market share in 2024, led by China, India, Japan, and South Korea. High population density, a well-established domestic textile and footwear manufacturing base, and cost-efficient production support large-scale consumption across mass and mid-range segments. India and Southeast Asia represent the fastest-growing markets, expanding above the global average due to rising disposable incomes, urbanization, and increasing adoption of branded footwear.
North America
North America accounted for nearly 31% of global market value, driven by premium pricing, high replacement frequency, and strong brand penetration across athletic and casual footwear categories. The United States dominates regional demand, supported by a mature athleisure culture, strong retail infrastructure, and high per-capita footwear consumption across both performance and lifestyle segments.
Europe
Europe represented around 22% of global demand, with strong consumption in Germany, the U.K., France, and Italy. A preference for quality, durability, and brand heritage underpins steady demand, while sustainability-driven purchasing behavior is increasingly influencing material selection, manufacturing transparency, and packaging choices across the region.
Latin America
Latin America accounted for approximately 6% of global revenue, led by Brazil and Mexico. Growing urban middle-class populations, improving retail access, and rising footwear imports are supporting gradual market expansion, with demand concentrated in affordable athletic, casual, and school footwear categories.
Middle East & Africa
The Middle East & Africa region contributed nearly 5% of global demand, supported by the UAE, Saudi Arabia, and South Africa. Demand is primarily concentrated in premium urban retail centers and import-driven markets, with brand visibility, fashion trends, and rising youth populations influencing purchasing behavior.
Company Market Share
The no-show socks market is moderately competitive, with the top five players accounting for approximately 42% of global market revenue. Brand strength, distribution reach, and product innovation remain the key competitive differentiators.
Leading Players in the No-Show Socks Market
- Nike, Inc.
- Adidas AG
- Puma SE
- Under Armour, Inc.
- Hanesbrands Inc.
- Bombas LLC
- Renfro Corporation
- Falke Group
- Stance, Inc.
- Gold Toe Brands
- Jockey International
- Decathlon
- Muji
- Uniqlo
- ASICS Corporation