Drive-in Movie Theater Market Size
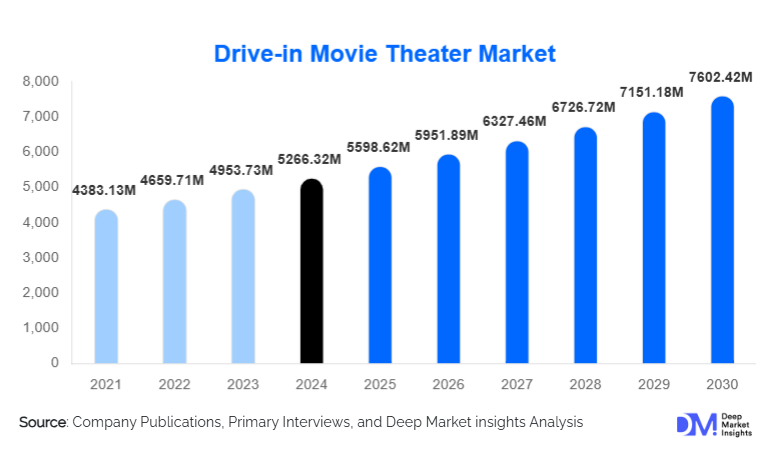
According to Deep Market Insights, the global drive-in movie theater market size was valued at USD 5,266.32 million in 2025 and is projected to grow from USD 5,598.62 million in 2026 to reach USD 7,602.42 million by 2031, expanding at a CAGR of 6.31% during the forecast period (2026–2031). The drive-in movie theater market growth is supported by renewed consumer interest in open-air entertainment, rising demand for experiential and community-based leisure activities, and increasing adoption of digital projection and mobile-enabled services. The market benefits from relatively low operational break-even thresholds, flexible seasonal models, and diversification into non-traditional content such as live sports, concerts, and private events.
Key Market Insights
- Drive-in theaters are evolving into multi-use experiential venues, hosting movies, live sports screenings, concerts, and private events.
- Digital projection and mobile ticketing dominate, accounting for over 70% of total market revenue in 2025.
- North America leads the global market, driven by strong cultural affinity, high vehicle ownership, and established infrastructure.
- Asia-Pacific is the fastest-growing region, supported by urban expansion, rising disposable incomes, and land availability.
- Independent operators dominate ownership, reflecting the localized and community-centric nature of drive-in theaters.
- Advertising and sponsorship revenue is expanding, as brands seek outdoor, localized, and experiential marketing platforms.
Drive-in Movie Theater Market Trends
Multi-Format Content Integration
Drive-in movie theaters are increasingly diversifying beyond traditional film screenings. Operators are integrating live sports broadcasts, music concerts, gaming tournaments, religious gatherings, and corporate events into their programming. This trend significantly improves screen utilization rates and reduces dependency on movie release schedules. Event-based programming has increased average revenue per screen by 25–35% for operators adopting diversified content strategies. Seasonal festivals and themed movie nights are also attracting younger audiences and repeat visitors.
Technology-Enabled Customer Experience
Digital transformation is reshaping the drive-in experience. Mobile ticketing, app-based concession ordering, contactless payments, and FM/Bluetooth audio transmission are becoming standard features. Digital projection systems allow operators to access first-run and alternative content more efficiently while reducing distribution costs. Data analytics tools are also being adopted to optimize pricing, personalize promotions, and improve demand forecasting, particularly during peak seasons.
Drive-in Movie Theater Market Drivers
Rising Demand for Experiential and Outdoor Entertainment
Consumers increasingly prioritize experiences over material goods, especially families and younger demographics seeking affordable, social, and nostalgic leisure activities. Drive-in theaters offer a unique blend of safety, convenience, and community engagement. This demand has remained resilient even as indoor cinemas and streaming platforms compete for consumer attention.
Lower Operating Costs Compared to Indoor Cinemas
Drive-in theaters benefit from lower fixed costs, reduced staffing requirements, and minimal indoor infrastructure expenses. Seasonal operations and flexible scheduling enable operators to maintain profitability despite fluctuations in attendance. This cost efficiency makes the model attractive for independent entrepreneurs and municipal partnerships.
Technological Modernization and Digital Compatibility
The widespread shift from analog to digital projection has enabled higher-quality visuals, simplified content licensing, and faster programming changes. Technology upgrades have also enhanced concession sales and advertising monetization, supporting margin expansion across the market.
Drive-in Movie Theater Market Restraints
Land Availability and Zoning Regulations
Permanent drive-in installations require large land parcels, which are increasingly scarce or expensive near urban centers. Zoning restrictions related to noise, traffic, and light pollution can delay or prevent new developments, particularly in Europe and densely populated Asian markets.
Weather Dependency and Seasonality
Drive-in theaters are highly exposed to weather conditions, limiting year-round operations in many regions. Rain, extreme temperatures, and seasonal daylight variations directly impact attendance and revenue predictability, posing challenges for long-term financial planning.
Drive-in Movie Theater Market Opportunities
Public–Private Partnerships and Municipal Projects
Municipal governments are increasingly partnering with private operators to activate underutilized land for cultural and community engagement. These partnerships reduce capital risk for operators while supporting local tourism and economic activity. Temporary and pop-up drive-ins are particularly attractive for cities hosting festivals and seasonal events.
Expansion in Emerging Markets
Asia-Pacific, Latin America, and parts of the Middle East present strong growth opportunities due to rising vehicle ownership, expanding suburban areas, and growing demand for affordable entertainment. Land availability and favorable demographics support new installations and scalable regional expansion.
Report Scope
| Report Metric | Details |
|---|---|
| Market Size in 2025 | USD 5266.32 Million |
| Market Size in 2026 | USD 5598.62 Million |
| Market Size in 2031 | USD 7602.42 Million |
| CAGR | 6.31% (2026-2031) |
| Base Year for Estimation | 2025 |
| Historical Data | 2022-2024 |
| Forecast Period | 2026-2031 |
| Report Coverage | Revenue Forecast, Competitive Landscape, Supply Chain Disruption, Growth Factors, Environment & Regulatory Landscape and Trends |
| Geographies Covered | North America, Europe, APAC, Middle East and Africa, LATAM |
| Countries Covered | U.S., Canada, U.K., Germany, France, Spain, Italy, Russia, Nordic, Benelux, Rest of Europe, China, Korea, Japan, India, Australia, Singapore, Taiwan, South East Asia, Rest of Asia-Pacific, UAE, Turky, Saudi Arabia, South Africa, Egypt, Nigeria, Rest of MEA, Brazil, Mexico, Argentina, Chile, Colombia, Rest of LATAM |
Explore more data points, trends and opportunities Download Free Sample Report
Revenue Source Insights
Ticket sales remain the largest revenue source, accounting for approximately 46% of the global market in 2025. Food and beverage sales contribute around 32%, supported by premium concessions and mobile pre-ordering. Advertising, sponsorships, and event rentals collectively represent over 22% of revenue and are the fastest-growing segments, driven by brand demand for localized experiential marketing.
Technology Adoption Insights
Digital projection dominates the market with a 71% share, as analog systems continue to be phased out due to content compatibility requirements. Hybrid digital and streaming-enabled drive-ins are emerging, allowing operators to host live broadcasts and alternative content, further enhancing revenue diversification.
End-Use Insights
Entertainment and leisure applications account for more than 80% of demand, led by family-oriented movie screenings. Corporate events, private rentals, and brand activations represent the fastest-growing end-use segment, expanding at nearly 11% CAGR. Educational screenings, religious gatherings, and sports broadcasts are emerging as niche applications.
Explore more data points, trends and opportunities Download Free Sample Report
Drive-in Movie Theater Market Segmentations
By Revenue Source
- Ticket Sales
- Food & Beverage Sales
- Advertising & Sponsorship
- Event Rentals & Private Screenings
By Ownership Model
- Independent Drive-in Operators
- Chain-Owned Drive-in Theaters
- Municipal / Public-Private Drive-ins
By Screen & Capacity Type
- Single-Screen Drive-ins
- Multi-Screen Drive-ins (2–5 Screens)
- Large-Format / Event-Based Drive-ins
By Technology Adoption
- Analog Projection
- Digital Projection (2K/4K)
- Hybrid Digital & Streaming-Enabled Drive-ins
By Vehicle Accommodation
- Passenger Cars
- SUVs & Pickup Trucks
- Mixed Vehicle & Lawn Seating
Regional Insights
North America
North America holds approximately 48% of the global drive-in movie theater market in 2025, with the United States alone accounting for about 42%. Strong cultural legacy, high vehicle ownership, and established infrastructure support sustained demand. Canada contributes steady seasonal growth.
Europe
Europe represents around 18% of the market, led by Germany, the U.K., and France. Demand is driven by temporary and festival-based drive-ins, with strong interest in outdoor cultural experiences.
Asia-Pacific
Asia-Pacific accounts for roughly 21% of global revenue and is the fastest-growing region, expanding at over 10% CAGR. China, Australia, India, and South Korea are key contributors, supported by urban expansion and rising disposable incomes.
Latin America
Latin America holds approximately 8% of the market, led by Brazil and Mexico. Growth is driven by tourism-focused installations and increasing interest in affordable outdoor entertainment.
Middle East & Africa
The Middle East & Africa region accounts for about 5% of global revenue, with demand concentrated in the UAE and South Africa. Tourism-centric drive-ins and event-based installations dominate regional growth.
Key Players in the Drive-in Movie Theater Market
- West Wind Drive-Ins
- Becky’s Drive-In Theatre
- Skyline Drive-In
- Bengies Drive-In Theatre
- Harvest Moon Drive-In
- Galaxy Drive-In
- Auto-Kinema Drive-In
- Starlight Drive-In
- Sunset Cinema
- Luna Drive-In
- Outdoor Cinema
- Cine Thisio Open Air
- Drive-In Australia
- Autokino Deutschland
- Rooftop Cinema Club