Party Supply Rental Market Size
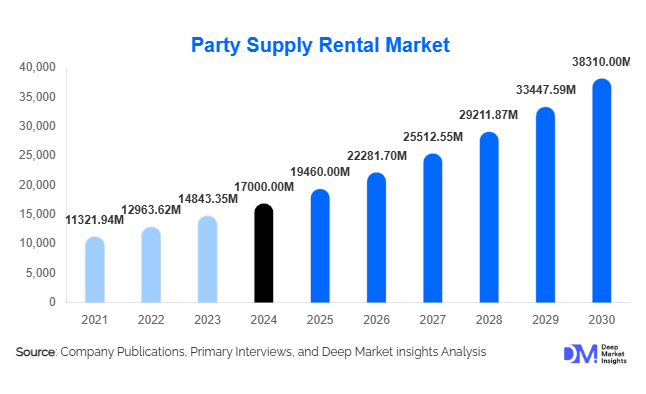
According to Deep Market Insights, the global party supply rental market size was valued at USD 17,000.00 million in 2025 and is projected to grow from USD 19,460.00 million in 2026 to reach USD 38,310.00 million by 2031, expanding at a CAGR of 14.5% during the forecast period (2026–2031). The market growth is driven by the surge in social and corporate events, increasing adoption of digital rental platforms, and growing preference for flexible, sustainable event solutions over ownership-based models.
Key Market Insights
- Tables and chairs rentals dominate the market, accounting for nearly 30% of total global rental revenues in 2025 due to their universal necessity across event types.
- Weddings and engagements remain the largest event category, representing about 34% of global demand for rented supplies.
- Digital transformation is reshaping the industry, as online booking portals and mobile apps streamline equipment selection, booking, and delivery.
- Asia-Pacific leads global growth, driven by rising disposable incomes, destination weddings, and outdoor event culture in countries such as India and China.
- North America maintains leadership by revenue share, supported by mature infrastructure and high per-capita event spending.
- Sustainability and reuse are becoming core value propositions, with providers emphasizing recyclable décor and energy-efficient lighting systems.
Latest Market Trends
Digitally Enabled Rental Platforms
The rise of digital platforms is revolutionizing how customers book and manage party rentals. Online marketplaces and mobile apps now allow users to compare packages, visualize event setups using augmented reality (AR), and track logistics in real time. This transformation reduces administrative burden for both customers and providers, while improving transparency in pricing and availability. The integration of AI-based inventory management tools is helping rental companies optimize asset utilization, reduce idle inventory, and forecast demand peaks with greater accuracy.
Sustainable and Reusable Event Solutions
Sustainability is increasingly at the heart of party rental services. Customers, especially corporate clients and eco-conscious consumers, are demanding reusable materials, energy-efficient lighting, and recyclable décor elements. Vendors are responding with offerings like biodegradable tableware, LED lighting systems, and water-based paint décor. This green transition is not only a response to regulatory pressure but also a competitive differentiator, helping rental firms attract environmentally aware event organizers and CSR-driven enterprises.
Party Supply Rental Market Drivers
Rising Global Event Expenditure
The growing frequency of corporate gatherings, social functions, and destination events has significantly expanded the need for rental solutions. From high-profile weddings to brand activations, the shift toward experience-centric events is encouraging short-term rentals for high-quality, customizable equipment. Increased spending on entertainment, corporate celebrations, and outdoor festivals is expected to sustain double-digit growth for the sector through 2031.
Growing Trend of Destination and Outdoor Events
Outdoor weddings, festivals, and corporate retreats are becoming more prevalent across all major regions. These events require specialized rental equipment, tents, lighting systems, portable seating, and modular stages, which are often expensive to own. The flexibility and scalability of renting, combined with professional setup and teardown services, make rentals the preferred choice. Emerging markets in Asia-Pacific and the Middle East are especially driving this trend, as climate-friendly and scenic outdoor venues gain popularity.
Technological Advancements and Ease of Access
The digitization of party rental services has increased market accessibility. From online booking to digital catalogs and contactless payment systems, technology is making event planning faster and simpler. AI-driven logistics and predictive maintenance are also reducing downtime for rental firms, while AR/VR tools enhance customer experience by allowing real-time setup visualization before final booking.
Market Restraints
High Inventory and Maintenance Costs
Party rental businesses are capital-intensive, requiring significant investment in inventory acquisition, warehousing, cleaning, and logistics. Depreciation, frequent handling, and damage during transport increase operational costs. Managing fleet utilization remains a key challenge, particularly for small and mid-sized rental providers facing cash flow constraints during off-peak seasons.
Seasonality and Demand Volatility
Event demand fluctuates significantly due to seasonal factors such as wedding periods, festivals, and holidays. This cyclicality causes underutilization of inventory in low-demand periods and logistical strain during peaks. Unexpected cancellations or weather disruptions also exacerbate volatility, making capacity planning and revenue forecasting difficult for operators.
Party Supply Rental Market Opportunities
Digital Integration and Online Marketplace Expansion
Rental companies can achieve scalability and reach by integrating into online event marketplaces or developing proprietary platforms with dynamic pricing, availability tracking, and real-time logistics coordination. AR visualization tools can provide immersive previews of décor and layout, attracting tech-savvy event planners. The use of customer data analytics for personalization and cross-selling further enhances retention and profitability.
Themed and Destination Event Growth
Destination weddings and corporate retreats are rapidly increasing across Asia-Pacific, the Middle East, and Europe. Rental firms can capitalize by offering turnkey solutions, tents, furniture, lighting, décor, catering equipment, tailored to specific themes and climates. Premium packages that emphasize luxury and convenience are expected to command higher margins, particularly among affluent clients and international organizers.
Sustainability-Driven Business Models
Sustainability is opening new markets for rental companies that prioritize circular economy practices. Eco-friendly inventory, reduced packaging waste, and energy-efficient setups align with global environmental goals and corporate ESG mandates. Providers offering sustainability certifications and carbon-offset rental packages are likely to gain preference among global brands and event planners committed to responsible event management.
Report Scope
| Report Metric | Details |
|---|---|
| Market Size in 2025 | USD 17000 Million |
| Market Size in 2026 | USD 19460 Million |
| Market Size in 2031 | USD 38310 Million |
| CAGR | 14.5% (2026-2031) |
| Base Year for Estimation | 2025 |
| Historical Data | 2022-2024 |
| Forecast Period | 2026-2031 |
| Report Coverage | Revenue Forecast, Competitive Landscape, Supply Chain Disruption, Growth Factors, Environment & Regulatory Landscape and Trends |
| Geographies Covered | North America, Europe, APAC, Middle East and Africa, LATAM |
| Countries Covered | U.S., Canada, U.K., Germany, France, Spain, Italy, Russia, Nordic, Benelux, Rest of Europe, China, Korea, Japan, India, Australia, Singapore, Taiwan, South East Asia, Rest of Asia-Pacific, UAE, Turky, Saudi Arabia, South Africa, Egypt, Nigeria, Rest of MEA, Brazil, Mexico, Argentina, Chile, Colombia, Rest of LATAM |
Explore more data points, trends and opportunities Download Free Sample Report
Product Type Insights
Among product categories, tables and chairs hold the largest market share at approximately 30% of 2025 revenues, valued at around USD 4.4 billion. Their universality across event types and frequent turnover make them indispensable. Tents and canopies are the second-largest category, driven by rising outdoor events, while audio-visual equipment rentals are among the fastest-growing, supported by corporate event demand and hybrid digital setups.
Application Insights
The weddings and engagements segment dominates the application landscape, accounting for nearly 34% of the global market. The emotional and social importance of weddings, especially in Asia and the Middle East, drives high rental spending. Corporate events form the second-largest segment, expected to grow at over 12% CAGR through 2031, supported by increasing brand activation events and conferences. Festivals, community events, and private parties also contribute strongly to recurring rental demand.
Distribution Channel Insights
On-site rental and setup services remain the primary channel, representing about 65% of the global market in 2025. This model’s popularity is due to its convenience and full-service nature, covering delivery, installation, and post-event dismantling. Online booking platforms and self-service rentals are expanding rapidly, particularly among small-scale customers who prefer transparent pricing and faster turnaround times.
End-Use Insights
Individual consumers represent approximately 36% of total rental demand, while corporate clients account for about 25%. Growth in the corporate/MICE segment is particularly strong in emerging markets where businesses increasingly outsource event management. Non-profit and government events form a steady base, particularly in Europe and North America, where community festivals and public celebrations maintain consistent demand.
Explore more data points, trends and opportunities Download Free Sample Report
Party Supply Rental Market Segmentations
By Product Type
- Tables & Chairs
- Tents & Canopies
- Lighting Equipment
- Audio-Visual Equipment
- Décor & Accessories
- Catering Equipment
By Application
- Weddings & Engagements
- Corporate Events
- Festivals & Community Gatherings
- Private Parties & Birthdays
- Trade Shows & Exhibitions
By Distribution Channel
- On-Site Rental Services
- Online Rental Platforms
- Direct Company Bookings
- Third-Party Event Planners
By End-User
- Individual Consumers
- Corporate Clients
- Event Management Companies
- Non-Profit & Government Organizations
Regional Insights
North America
North America remains a major revenue contributor, holding around 31% of the global share ( USD 4.5 billion in 2025). The U.S. leads the region with mature event infrastructure, high consumer spending, and a growing corporate event culture. Trends such as experiential weddings, outdoor corporate galas, and themed décor rentals are driving premium segment growth.
Europe
Europe accounts for nearly one-fourth of the global market, led by the U.K., Germany, and France. The region is characterized by established event industries, demand for high-quality aesthetics, and a shift toward sustainable and reusable rental materials. Destination weddings in Southern Europe (Italy, Spain, Greece) are fueling steady growth, especially among international clients.
Asia-Pacific
Asia-Pacific is the fastest-growing region, capturing approximately 37% of the global market ( USD 5.3 billion). India and China are leading the surge, propelled by lavish wedding celebrations, festivals, and the rise of organized event management companies. The region’s CAGR of 12–15% through 2031 positions it as the global growth engine for party rental services.
Latin America
Latin America represents about 9% of the global market, with Brazil and Mexico at the forefront. Urbanization, rising middle-class incomes, and growing corporate events in major cities are spurring the adoption of professional rental services. Regional players are investing in diversified inventory to meet the evolving needs of themed and outdoor celebrations.
Middle East & Africa
The Middle East & Africa region, with around 11% market share, is rapidly evolving into a destination-event hub. The UAE and Saudi Arabia are witnessing growing demand for luxury wedding setups and large-scale corporate galas. Africa, particularly South Africa and Nigeria, has strong growth potential in community festivals and outdoor events. Regional growth rates between 12–15% are expected through 2031.
Key Players in the Party Supply Rental Market
- CORT Party Rental Corporation
- Chase Canopy Company Inc.
- Marquee Event Group LLC
- Bright Event Rentals LLC
- Quest Events LLC
- Hall’s Rental Service Inc.
- All Occasions Party Rental Inc.
- Party Reflections Inc.
- Stuart Event Rentals Inc.
- Avalon Event Rentals Inc.
- Baker Party Rentals
- Classic Party Rentals LLC
- Elite Party Rentals Inc.
- Abbey Tent & Party Rentals Inc.
- Diamond Event and Tent LLC