MICE Tourism Market Size
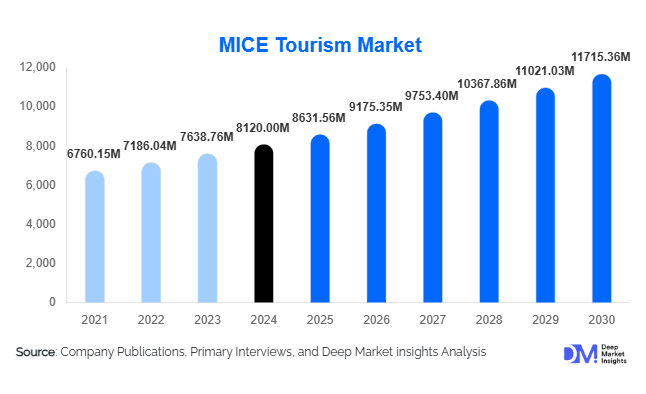
According to Deep Market Insights, the global mice tourism market size was valued at USD 8,120.00 million in 2025 and is projected to grow from USD 8,631.56 million in 2026 to reach USD 11,715.36 million by 2031, expanding at a CAGR of 6.3% during the forecast period (2026-2031). The MICE tourism market is experiencing growth driven by the continued globalization of business operations, rising corporate travel budgets, and strong government support for business tourism infrastructure. High per-capita spending, longer average stays, and strong multiplier effects on hospitality, aviation, and local services continue to position MICE tourism as one of the most economically impactful segments of the global travel industry.
Key Market Insights
- Exhibitions and trade shows remain the largest revenue-generating segment, supported by strong B2B demand and high exhibitor and sponsorship spending.
- Corporate enterprises dominate end-use demand, accounting for more than 60% of global MICE tourism revenue.
- North America leads the global market, driven by the United States’ mature convention infrastructure and strong multinational corporate presence.
- The Asia-Pacific region is the fastest-growing market, driven by rapid infrastructure development in China, India, Singapore, and Japan.
- Incentive travel is the fastest-growing event type, benefiting from rising focus on employee retention and performance-based rewards.
- Technology adoption, including hybrid events, AI-driven matchmaking, and smart venues, is reshaping event planning and monetization models.
MICE Tourism Market Trends
Rapid Adoption of Hybrid and Technology-Enabled Events
Hybrid events combining physical attendance with virtual participation are becoming a standard format across conferences and exhibitions. Event organizers are integrating AI-powered networking tools, virtual exhibition halls, and advanced analytics to enhance engagement and extend event reach beyond physical attendees. These technologies allow organizers to increase sponsorship value, generate recurring digital revenues, and reduce dependency on venue capacity. Smart convention centers equipped with IoT-enabled crowd management, digital check-ins, and real-time data dashboards are increasingly preferred by large-scale international events.
Emergence of New MICE Destinations
Emerging economies are aggressively positioning themselves as global MICE hubs through large-scale infrastructure investments and policy incentives. Countries in the Middle East and Asia-Pacific are developing integrated convention districts combining venues, hotels, airports, and entertainment zones. Competitive pricing, visa facilitation, and government-backed bidding support are enabling newer destinations to attract international conventions and exhibitions that were traditionally hosted in North America or Europe.
MICE Tourism Market Drivers
Globalization of Business and Trade
Cross-border business expansion, international trade agreements, and global supply chains continue to fuel demand for face-to-face interactions. High-value negotiations, product launches, and industry networking events rely heavily on in-person engagement, sustaining demand for conferences, conventions, and exhibitions. Despite digital communication tools, physical events remain critical for trust-building and deal-making, reinforcing MICE tourism demand.
Rising Corporate Travel and Incentive Budgets
Corporations are reinstating and expanding travel budgets following pandemic-related restrictions. Incentive travel programs, sales kick-offs, and leadership meetings are increasingly prioritized due to their proven impact on productivity, engagement, and employee retention. Industries such as IT, BFSI, pharmaceuticals, and manufacturing are major contributors to this growth, driving stable year-round demand.
MICE Tourism Market Restraints
Cost Sensitivity and Economic Volatility
MICE tourism budgets are highly sensitive to macroeconomic conditions. Rising airfare, accommodation costs, and inflationary pressures can lead to event postponements or downsizing. Economic uncertainty and geopolitical tensions may also impact international delegate participation, particularly for large-scale global events.
Operational Complexity and Sustainability Pressures
Large MICE events require complex coordination across venues, logistics, travel, and regulatory compliance. Increasing pressure to reduce carbon emissions and meet sustainability standards adds further complexity and cost. Event organizers must balance environmental responsibilities with cost efficiency and delegate experience.
MICE Tourism Market Opportunities
Government-Led Infrastructure Development
Governments are increasingly recognizing MICE tourism as a strategic economic driver and are investing heavily in convention centers, exhibition halls, and integrated business districts. Public-private partnerships, tax incentives, and destination marketing support create long-term opportunities for venue operators, event organizers, and service providers to secure recurring international events.
Growth of Incentive Travel and Experiential Programs
Incentive travel offers one of the highest per-delegate spending profiles within the MICE segment. Companies are shifting toward experiential rewards that combine business objectives with leisure, wellness, and cultural immersion. This creates opportunities for customized travel planners, destination management companies, and luxury hospitality providers.
Report Scope
| Report Metric | Details |
|---|---|
| Market Size in 2025 | USD 8120 Million |
| Market Size in 2026 | USD 8631.56 Million |
| Market Size in 2031 | USD 11715.36 Million |
| CAGR | 6.3% (2026-2031) |
| Base Year for Estimation | 2025 |
| Historical Data | 2022-2024 |
| Forecast Period | 2026-2031 |
| Report Coverage | Revenue Forecast, Competitive Landscape, Supply Chain Disruption, Growth Factors, Environment & Regulatory Landscape and Trends |
| Geographies Covered | North America, Europe, APAC, Middle East and Africa, LATAM |
| Countries Covered | U.S., Canada, U.K., Germany, France, Spain, Italy, Russia, Nordic, Benelux, Rest of Europe, China, Korea, Japan, India, Australia, Singapore, Taiwan, South East Asia, Rest of Asia-Pacific, UAE, Turky, Saudi Arabia, South Africa, Egypt, Nigeria, Rest of MEA, Brazil, Mexico, Argentina, Chile, Colombia, Rest of LATAM |
Explore more data points, trends and opportunities Download Free Sample Report
Event Type Insights
Exhibitions and trade shows account for approximately 34% of global MICE tourism revenue, driven by high exhibitor participation and sponsorship income. Conferences and conventions represent around 27%, supported by recurring association and industry events. Meetings tourism contributes 22%, reflecting high frequency but smaller average event sizes. Incentive tourism accounts for 17% of the market but is the fastest-growing segment, supported by rising corporate focus on employee engagement and retention.
End-Use Insights
Corporate enterprises dominate MICE tourism demand, contributing nearly 62% of global revenue in 2025. Government and public sector events account for approximately 18%, driven by international summits, trade delegations, and policy forums. Associations and non-profit organizations contribute around 14%, while academic and research institutions represent the remaining share through conferences and congresses.
Explore more data points, trends and opportunities Download Free Sample Report
MICE Tourism Market Segmentations
By Event Type
- Meetings Tourism
- Incentive Tourism
- Conferences & Conventions
- Exhibitions & Trade Shows
By End-Use Industry
- Corporate Enterprises
- Government & Public Sector
- Associations & Non-Profit Organizations
- Academic & Research Institutions
By Booking Channel
- Direct Corporate Booking
- Professional Conference Organizers (PCOs)
- Destination Management Companies (DMCs)
- Event Technology Platforms
By Event Size
- Small Events (≤50 Delegates)
- Mid-Sized Events (51–500 Delegates)
- Large Events (>500 Delegates)
Regional Insights
North America
North America accounts for approximately 32% of the global MICE tourism market, led by the United States, which alone contributes nearly 25% of global revenue. Strong corporate presence, mature convention infrastructure, and high international connectivity support sustained demand.
Europe
Europe represents around 28% of the global market, with Germany, the UK, France, and Spain serving as major exhibition and convention hubs. Europe remains a key destination for international association events and trade fairs.
Asia-Pacific
Asia-Pacific holds nearly 26% of the market and is the fastest-growing region, with a CAGR exceeding 8%. China, Singapore, Japan, and India are leading the demand due to rapid infrastructure development and rising international business activity.
Latin America
Latin America accounts for about 5% of global MICE tourism demand, led by Mexico and Brazil. Growth is driven by regional trade exhibitions and increasing international business engagement.
Middle East & Africa
The Middle East & Africa region contributes approximately 9% of global revenue. The UAE and Saudi Arabia are emerging as major MICE hubs, supported by large-scale government investments and strong air connectivity.
Key Players in the MICE Tourism Market
- Informa Markets
- RX Global (Reed Exhibitions)
- Messe Frankfurt
- GL Events
- Messe München
- Deutsche Messe
- Koelnmesse
- Tarsus Group
- Clarion Events
- Hyve Group
- Fiera Milano
- Comexposium
- Emerald Expositions
- UBM Asia
- MCI Group