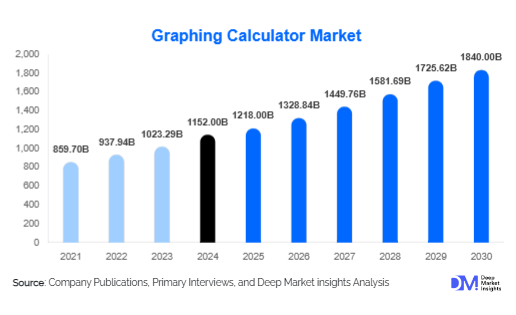
Graphing Calculator Market Size
According to Deep Market Insights, the global graphing calculator market size was valued at USD 1,152 million in 2025 and is projected to grow from USD 1,218 million in 2026 to reach USD 1,840 million by 2031, expanding at a CAGR of 9.1% during the forecast period (2026–2031). The market growth is primarily driven by increasing adoption of graphing calculators in STEM education, rising integration of calculators with advanced digital tools, and growing demand from professional sectors such as engineering, finance, and data analysis. Technological innovations and interactive learning solutions are further enhancing their appeal globally.
Key Market Insights
- Educational adoption remains the dominant growth driver, with institutions integrating graphing calculators into curricula to enhance math and science learning outcomes.
- Technologically advanced calculators with connectivity features are gaining traction, allowing users to interface with computers, mobile apps, and cloud platforms.
- North America holds a significant market share, led by strong adoption in schools, colleges, and universities.
- Asia-Pacific is emerging as the fastest-growing region, driven by increased investments in STEM education and rising demand for affordable graphing calculators.
- Professional use in engineering, finance, and analytics sectors is supporting market growth beyond educational segments.
- Online distribution channels and e-learning integration, including subscription-based platforms, are reshaping how graphing calculators are purchased and utilized.
Graphing Calculator Market latest trends
Integration with Digital Learning Platforms
Graphing calculators are increasingly being integrated with digital learning platforms to enhance student engagement and interactive learning. Modern calculators allow connectivity with apps, cloud storage, and collaborative tools, enabling students to save, share, and analyze data in real time. This trend is particularly prominent in STEM education, where educators prefer devices that complement online lessons, virtual labs, and AI-driven tutoring systems. Digital integration also supports distance learning and hybrid classroom environments, making graphing calculators relevant in increasingly technology-focused curricula.
Enhanced Functionality and Programmable Features
Advanced graphing calculators now include programmable functions, graphical simulation capabilities, and specialized applications for finance, statistics, and engineering. Users can customize workflows, perform complex calculations, and visualize data through 2D and 3D graphing tools. These capabilities are driving adoption in professional sectors as well as among high-school and college students pursuing advanced courses. The trend toward multi-functional devices reduces dependency on multiple software tools and enhances learning efficiency.
Graphing Calculator Market key drivers
Expansion of STEM Education Globally
The increasing emphasis on STEM education worldwide has boosted the demand for graphing calculators. Schools, colleges, and universities are incorporating calculators into math, physics, and engineering programs to improve analytical and problem-solving skills. Government initiatives and private educational programs promoting STEM learning are further driving adoption. Countries such as the U.S., China, and India are investing heavily in STEM infrastructure, leading to a consistent increase in calculator sales and supporting the long-term growth of the market.
Professional and Specialized Applications
Beyond education, graphing calculators are widely used in engineering, finance, and statistical research. Professionals utilize calculators for complex calculations, modeling, and simulations. The growth of data-driven industries, computational finance, and engineering analysis has fueled demand for calculators with advanced programmable and graphical functions. Increasing reliance on calculators for certification exams, professional training, and analytical tasks underlines their continued relevance in these sectors.
Technological Innovations and User-Friendly Interfaces
Manufacturers are introducing innovative calculators with touchscreen displays, color graphing, AI-assisted problem solving, and mobile app integration. These innovations enhance usability, reduce learning curves, and appeal to tech-savvy students and professionals. The adoption of smart calculators with cloud compatibility, USB connectivity, and real-time collaboration tools has significantly expanded the market, particularly in advanced academic and professional applications.
Graphing Calculator Market restraints
High Cost of Advanced Graphing Calculators
High-end graphing calculators remain expensive, particularly those with programmable and 3D graphing capabilities. This cost factor limits adoption among price-sensitive students and institutions in developing regions. The high initial investment, combined with the availability of free or low-cost software alternatives, can deter potential buyers.
Competition from Software-Based Solutions
The growing availability of graphing and computational software, mobile apps, and online platforms presents a challenge to traditional calculator sales. While hardware calculators remain preferred for exams and standardized tests, software solutions offer flexibility, cost-effectiveness, and enhanced graphical features, potentially slowing market growth in non-exam applications.
Graphing Calculator Market key opportunities
Integration with E-Learning and Hybrid Education
The rise of online and hybrid learning models presents significant opportunities for graphing calculator manufacturers. By developing calculators that seamlessly integrate with e-learning platforms, institutions can enhance interactive learning, track student performance, and encourage collaboration. This integration also expands the market for subscription-based and software-enabled calculator solutions, offering new revenue streams.
Emerging Markets in Asia-Pacific and LATAM
Growing investment in STEM education in Asia-Pacific countries such as India, China, and Southeast Asia provides a substantial growth opportunity. Governments and private institutions are focusing on enhancing math and science curricula, creating demand for affordable, durable, and technologically advanced calculators. Latin American countries like Brazil and Mexico are also seeing increasing adoption in schools and universities, representing untapped market potential for new entrants.
Professional and Certification Exam Applications
With increasing requirements for specialized calculators in engineering, finance, and actuarial exams, manufacturers can target professional segments. Developing calculators tailored for certifications and complex analytical tasks opens a niche market with higher margins. Additionally, partnerships with exam boards and educational institutions can drive adoption, ensuring sustained demand.
Product Type Insights
Scientific calculators remain a widely used type, especially in secondary education, but graphing calculators dominate advanced STEM programs due to their complex graphing and programmable functions. High-end graphing calculators, with 3D graphing, CAS (Computer Algebra System), and connectivity features, account for approximately 42% of the market in 2025. Entry-level models remain significant in developing regions, catering to cost-sensitive students while enabling basic graphical analysis. The trend is shifting toward multi-functional devices that combine graphing, programming, and connectivity, supporting both academic and professional use.
Application Insights
Education represents the largest application segment, contributing nearly 65% of the global market in 2025. Within this, high-school and university-level STEM programs drive the majority of demand. Professional use in finance, engineering, and statistical analysis accounts for roughly 25% of the market. Emerging applications in coding education, data analysis, and research simulations are expected to increase the market share of professional usage, while specialized exam-focused calculators continue to maintain steady demand.
Distribution Channel Insights
Online sales channels, including e-commerce platforms and manufacturer websites, are becoming dominant, accounting for over 40% of total sales. Educational distributors and institutional procurement channels also contribute significantly, particularly in developed regions. Retail stores remain relevant for immediate purchases, especially in emerging markets. Partnerships with online learning platforms and subscription-based offerings for schools and universities are emerging as new distribution models.
End-Use Insights
Graphing calculators see the highest adoption in educational institutions, followed by professional sectors such as engineering firms, financial services, and research labs. The fastest-growing end-use segment is higher education and professional certification programs, driven by the increasing need for advanced computation and visualization tools. Export-driven demand is particularly strong from North America and Europe to the APAC regions, reflecting the rising global adoption of standardized curricula and professional certifications. The estimated demand from educational institutions alone accounts for USD 748 million in 2025, highlighting the sector’s critical role in market growth.
| By Product Type | By Application | By Distribution Channel |
|---|---|---|
|
|
|
Regional Insights
North America
North America holds approximately 35% of the global graphing calculator market in 2025, driven by strong adoption in U.S. and Canadian schools and universities. Government initiatives to promote STEM education and standardized testing requirements support consistent demand. Technologically advanced calculators and professional use in engineering and finance further strengthen market growth.
Europe
Europe accounts for 28% of the 2025 market, with Germany, the U.K., and France leading adoption. Strong curricula integration, high disposable incomes, and awareness of advanced calculator functionalities contribute to steady demand. Educational institutions are increasingly incorporating programmable calculators and integrating them with digital learning platforms.
Asia-Pacific
APAC is the fastest-growing region, led by India, China, and Japan. Government-led STEM initiatives, growing student populations, and rising digital education adoption are key drivers. Market growth is expected at a CAGR of 11.3% from 2026–2036, representing a lucrative opportunity for both new entrants and established manufacturers.
Latin America
Latin America, including Brazil and Mexico, is gradually increasing adoption. Investment in secondary and higher education, coupled with the popularity of standardized exams, supports demand. Market growth is moderate but expected to accelerate with improved accessibility and affordable device offerings.
Middle East & Africa
The Middle East, led by the UAE and Saudi Arabia, is growing due to STEM education initiatives and rising professional applications. Africa’s demand is emerging slowly, concentrated in South Africa and Kenya, driven by urban schools and universities adopting modern STEM tools.
| North America | Europe | APAC | Middle East and Africa | LATAM |
|---|---|---|---|---|
|
|
|
|
|
Key Players in the Graphing Calculator Market
- Texas Instruments
- Casio
- Hewlett-Packard (HP)
- Sharp
- Canon
- NumWorks
- Desmos
- ACM Calculator
- TI-Nspire
- Casio fx-CG Series
- HP Prime
- Sharp EL Series
- Canon F-718
- NumWorks Graphing Calculator
- Desmos Graphing Calculator (Web/App)